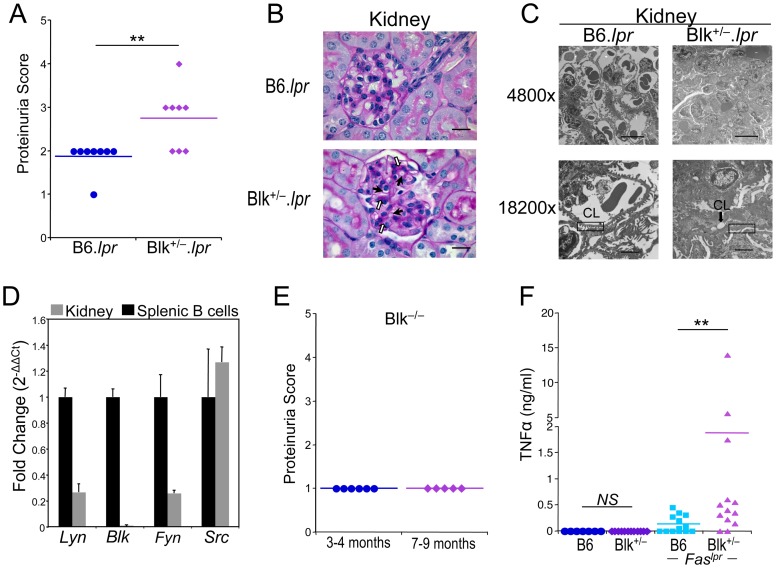
Figure 2. 5-month-old Blk+/−.lpr mice exhibit proteinuria and nephrosis.
(A) Comparison of proteinuria scores between 5-month-old B6.lpr and Blk+/−.lpr mice. 0 = 0 mg/dl; 1 = trace; 2 = 30 mg/dl; 3 = 100 mg/dl; 4 = 300 mg/dl; 5 = >300 mg/dl. Each symbol represents an individual mouse. (B) Representative light micrographs of PAS stained kidney sections from 5-month-old B6.lpr (n = 7) and Blk+/−.lpr (n = 8) mice at 1000× magnification. Filled arrows highlight examples of narrowed capillary lumens, while open arrows highlight examples of PAS-positive hyaline deposits. Bar = 20 μm. (C) Electron micrographs of glomeruli from 5-month-old B6.lpr and Blk+/−.lpr mice. Line in bottom of micrographs represents 10 μm in the 4800× magnification and 2 μm in the 18200× magnification. CL, capillary lumen. Rectangular boxes highlight normal (left panel) and shortened/fused (right panel) podocyte foot processes. (D) Quantitative real-time RT-PCR analysis showing expression of Src, Fyn, Lyn but not Blk in B6 kidney. Data were normalized to Gapdh levels and are presented as fold change over purified splenic B cells (set to 1). Data represent 4 kidney samples and 4 B cell samples. (E) Proteinuria scores for 3- to 4-month-old and 7- to 9-month old Blk−/− mice. Each symbol represents an individual mouse. (F) Comparison of serum TNFα levels between 5-month-old B6.lpr and Blk+/−.lpr mice. Each symbol represents an individual mouse. 5/13 (38.5%) of B6.lpr mice and 11/13 (84.6%) of Blk+/−.lpr mice have serum TNFα concentrations greater than 0.1 ng/ml. **p ≤ 0.01.

