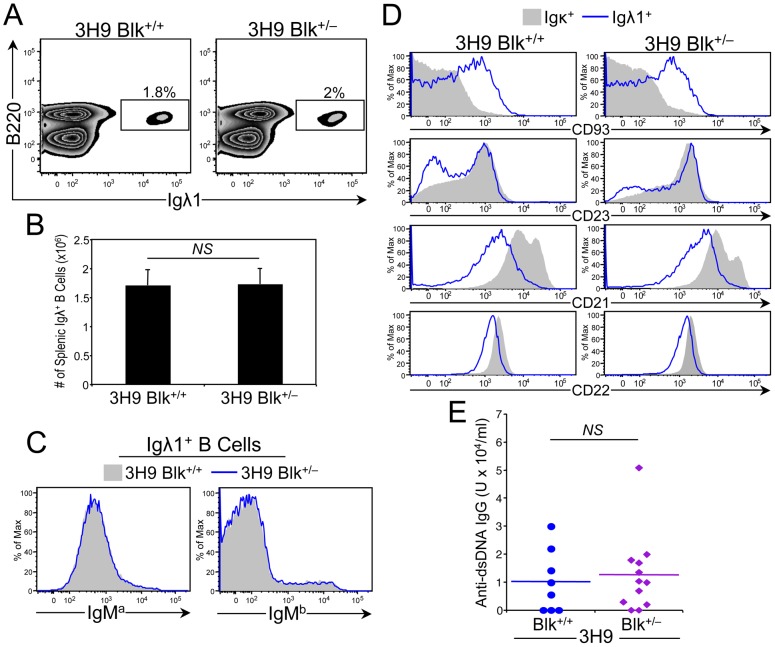
Figure 5. Effect of reducing Blk expression on B cell tolerance induction in 3H9 Tg mice.
(A) Representative dot plots showing Igλ1 versus B220 expression on total splenocytes from 6-month-old 3H9 Tg Blk+/+ and 3H9 Tg Blk+/− mice. Numbers in plots represent percentage of anti-DNA B cells (B220+ Igλ1+). (B) Graph comparing absolute numbers of anti-DNA B cells in the spleens of 6-month-old 3H9 Tg Blk+/+ (n = 7) and 3H9 Tg Blk+/− (n = 8) mice. (C) Histograms comparing IgMa (allotype of 3H9 IgH transgene) and IgMb (allotype of endogenous IgH) surface levels on gated Igλ1+ B cells from 6-month-old 3H9 Tg Blk+/+ (n = 7) and 3H9 Tg Blk+/− (n = 8) mice. (D) Histograms comparing CD93, CD23, CD21 and CD22 levels on gated Igκ+ (contains B cells that do not bind DNA) and Igλ1+ B cells from 6-month-old 3H9 Tg Blk+/+ (n = 7) and 3H9 Tg Blk+/− (n = 8) mice. (E) Comparison of anti-dsDNA IgG antibodies in 6-month-old 3H9 Tg Blk+/+ and 3H9 Tg Blk+/− mice. Each symbol represents an individual mouse.

