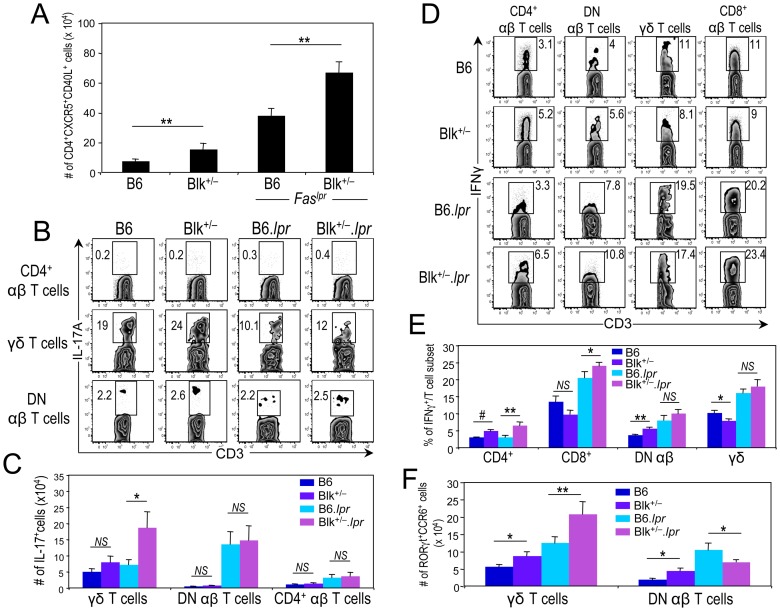
Figure 7. Reducing Blk expression in B6.lpr mice increases numbers of IFNγ-, IL-17A-, and IL-21-producing T cells.
(A) Graph comparing the number of splenic Tfh cells, defined as CD4+ CXCR5+ CD40L+ cells, between 3-month-old B6 (n = 6) and Blk+/− (n = 6) mice and between 3-month-old B6.lpr (n = 7) and Blk+/−.lpr (n = 8) mice. (B) pLN cells from 3-month-old B6, Blk+/−, B6.lpr and Blk+/−.lpr were stimulated with Leukocyte Activation Cocktail for 4 hours. Representative dot plots showing CD3 versus IL-17A expression in CD4+ αβ T cells (top), γδ T cells (middle) and in DN αβ T cells (bottom) from B6, Blk+/−, B6.lpr and Blk+/−.lpr mice. Numbers represent percentages of IL-17A+ cells. (C) Graph summarizing data in (B). Comparison of the number of IL-17A+ cells per T cell subset between 3-month-old B6 (n≥4) and Blk+/− (n≥5) mice and between 3-month-old B6.lpr (n≥7) and Blk+/−.lpr (n≥8) mice. (D) Splenocytes from 3-month-old B6, Blk+/−, B6.lpr and Blk+/−.lpr mice were stimulated with Leukocyte Activation Cocktail for 4 hours. Representative dot plots show CD3 versus IFNγ expression in gated CD4+, CD8+, DN αβ and γδ T cell subsets. Numbers represent percentages of IFNγ+ cells. (E) Graph summarizing data in (D). Comparison of the percentage of IFNγ+ cells per T cell subset between 3-month-old B6 (n = 4) and Blk+/− (n = 4) mice and between 3-month-old B6.lpr (n = 5) and Blk+/−.lpr (n = 5) mice. (F) Graph comparing the numbers of RORγt+ CCR6+ γδ T cells (γδ-17 cells) and DN αβ T cells (DN-17 cells) between the pLNs of 3-month-old B6 (n = 8) and Blk+/− (n = 7) mice and between the pLNs of 3-month-old B6.lpr (n = 8) and Blk+/−.lpr (n = 12) mice. *p ≤ 0.05; **p ≤ 0.01; #p ≤ 0.001.

