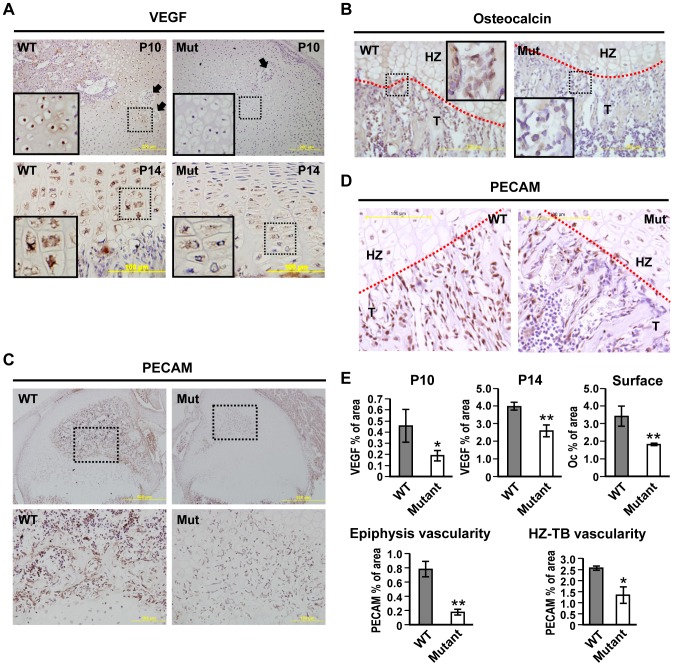
Figure 7. Reduced VEGF and osteocalcin expression with reduced vascularity in Zdhhc13 deficiency mutation mice.
Immunohistochemistry (IHC) of (A) VEGF in P10 (upper panel) and P14 (lower panel) WT and mutant distal femoral epiphysis. Black arrows indicate the cartilage canals surrounded by hypertrophic chondrocytes. Dashed-squares indicated the emphasized area shown in bottom left. (B) Osteocalcin in P14 WT and mutant epiphysis growth plate. Dashed-squares indicate the emphasized area. (C) Endothelial marker PECAM in P14 epiphysis SOC (upper panel) and higher magnification of dashed-area showing PECAM positive cells aligned cartilage canals and SOC cavity (lower panel). (D) PECAM in P14 WT and mutant epiphysis growth plate. (E) Quantitative results of VEGF, Oc and PECAM IHC. The results were demonstrated as % of area. VEGF staining was quantified as positive stained area among HZ region (represents panel A). Oc staining was quantified as positive stained area on trabecular bone surface (represents panel B). PECAM quantification was separated in to positive stained area within epiphysis (epiphysis vascularity, represents panel C) and positive area among HZ and trabecular bone (HZ-TB vascularity, represents panel D). The statistic comparison was performed using three WT and three mutants IHC in each group. Mut: mutant; HZ: hypertrophic zone; T: trabecular bone; red dash lines: interface of cartilage and bone. *P<0.05;**P<0.01.

