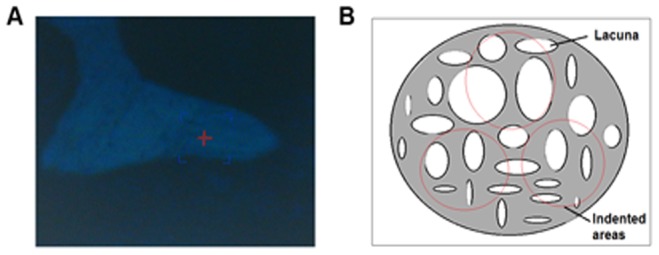
Figure 2. Indentation sites for nanoindentation test.

Sample thickness is 2(A) Actual indented sites marked by red cross under optical microscopy; (B) Sketch map of indented areas marked by red circle.

Sample thickness is 2(A) Actual indented sites marked by red cross under optical microscopy; (B) Sketch map of indented areas marked by red circle.