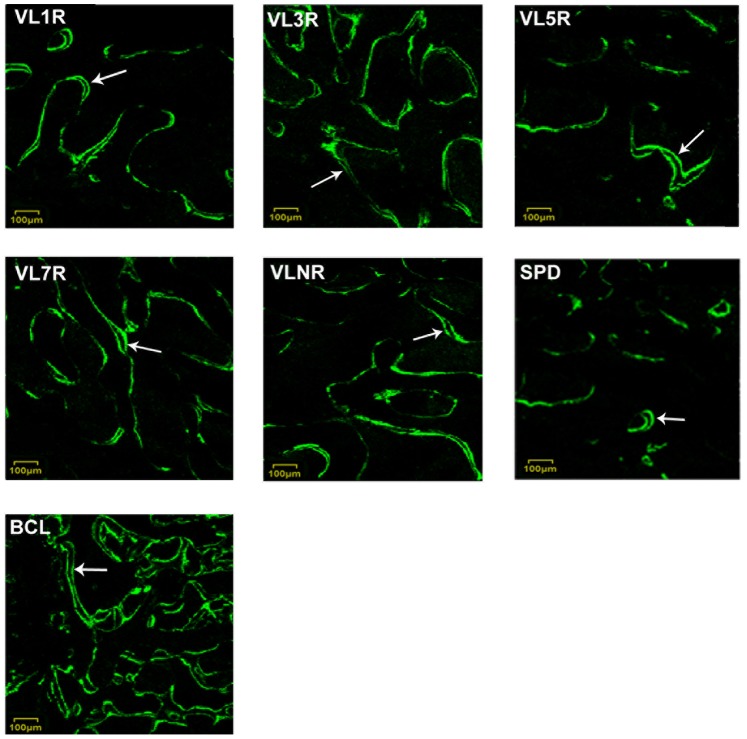
Figure 6. Fluorescence graphs of cancellous bones in proximal femurs.
Arrows show the areas where the mineral apposition rate and bone formation rate were measured. VL1R: Vibrational loading for 1 d followed by 1 d rest group; VL3R: Vibrational loading for 3 d followed by 3 d rest group; VL5R: Vibrational loading for 5 d followed by 5 d rest group; VL7R: Vibrational loading for 7 d followed by 7 d rest group; VLNR: Vibrational loading for no rest day or vibrational loading every day; SPD: Tail suspension group; BCL: Baseline control group.

