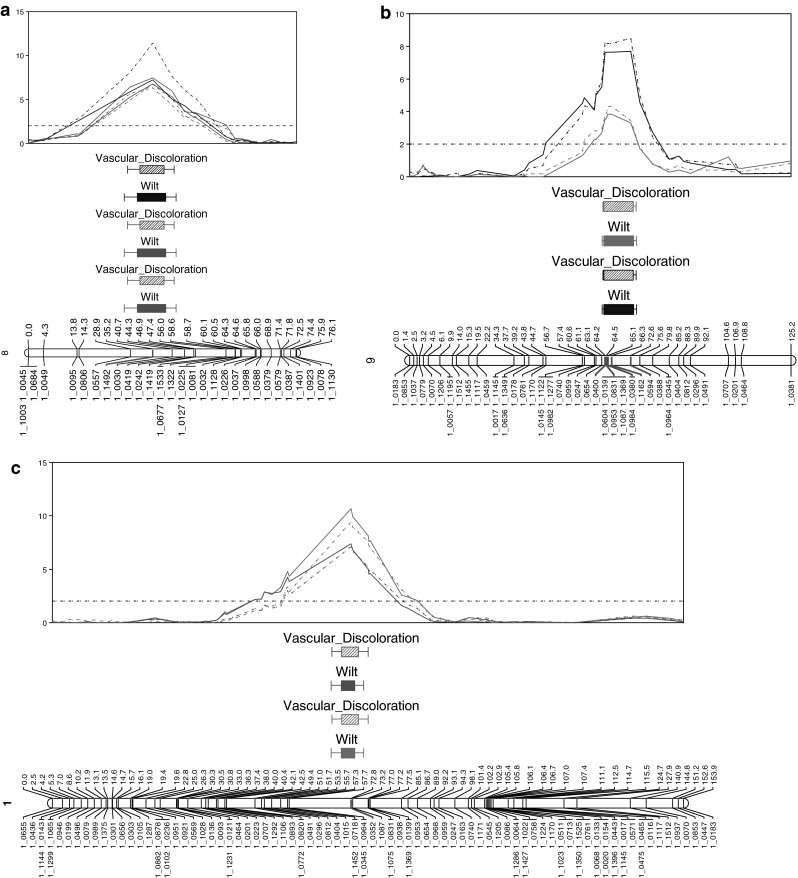
Fig. 1.

a Resistance to Fusarium oxysporum f.sp. tracheiphilum race 4: Fot4-1 QTL in the IT93K-503-1 × CB46 population. The Fot4-1 QTL mapped to linkage group 8. LOD scores for the first (2007), second (2010a), and third (2010b) experiments are plotted in red, green, and blue, respectively. Solid colored lines indicate the wilting/stunting phenotype and broken colored lines indicate the vascular discoloration phenotype. SNP marker 1_1492, which is highlighted in red, showed the most significant association with Fot race 4 over the three experiments. The LOD significance threshold of 2.0 is indicated by a horizontal broken line. b Resistance to Fusarium oxysporum f.sp. tracheiphilum race 4: Fot4-2 QTL in the CB27 × 24-125B-1 population. The Fot4-2 QTL mapped to linkage group 9. LOD scores are plotted in blue and pink for the first and second experiments, respectively. Over the two experiments, SNP markers 1_0594, 1_0984, 1_0380, and 1_1162 showed the most significant association with Fot race 4 resistance and are highlighted in red on the linkage group. The LOD significance threshold of 2.0 is indicated by a horizontal broken line. c Resistance to Fusarium oxysporum f.sp. tracheiphilum race 4: Fot4-2 QTL in the CB27 × IT82E-18/Big Buff population. The Fot4-2 QTL mapped to linkage group 1. LOD scores for the two experiments are plotted in green and pink. SNP marker 1_0352 was the most significant marker over both experiments and is highlighted in red. The LOD significance threshold of 2.0 is indicated by a horizontal broken line. (Color figure online)
