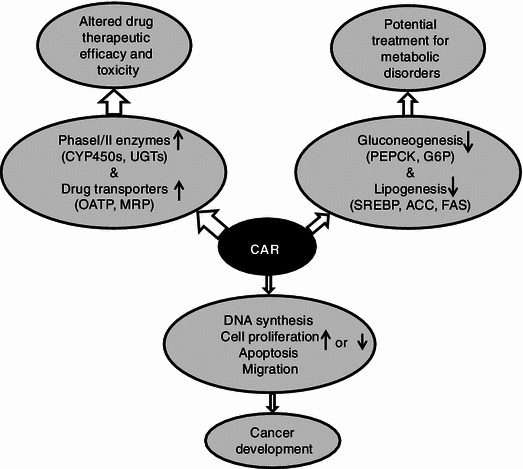
Figure 1.

Schematic illustration of biological functions of CAR. The size of hollow arrows indicates the abundance of available evidence for each function of CAR. Up and down black arrows symbolize increased and decreased gene expression, respectively
