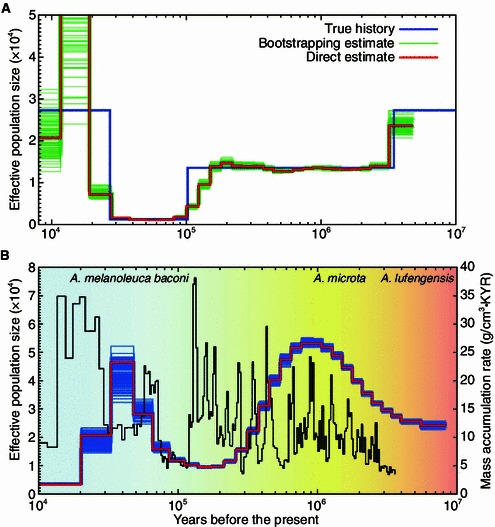
Figure 2.

Human and giant panda demographic history inferred by PSMC (See details in Li and Durbin (2011) and Zhao et al. (2013)). (A) The history recovered using human reference genome, which shows a bottle neck during 3–10 Kya following an explosive growth. The red curve is the PSMC estimate on the originally simulated sequence; the 100 thin green curves are the PSMC estimates on 100 sequences randomly resampled from the original sequence. The blue curve is the population-size history of human used in simulation. (B) The history recovered using giant panda genome, in which two peaks of population growth and two bottle necks are detected. The red line represents the estimated effective population size (Ne); the 100 thin blue curves represent the PSMC estimates for 100 sequences randomly resampled from the original sequence; the brown line shows the MAR of Chinese loess which represents the climate changes during the history
