
Table 5.
Changes in visual analog scale scores by treatment group
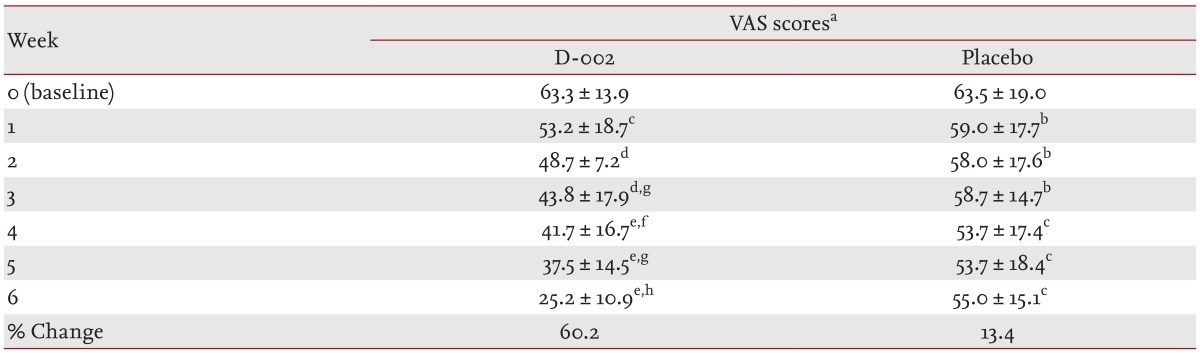
Values are presented as mean ± SD.
VAS, visual analog scale.
aMeasured on a 100 mm scale (0-100; where 0 = no pain, 100 = the worst possible pain).
bp < 0.0083, cp < 0.001, dp < 0.0001, ep < 0.00001. Comparisons versus baseline (Wilcoxon test) (Bonferroni adjustment).
fp < 0.01, gp < 0.001, hp < 0.0001. Comparisons versus placebo group (Mann-Whitney U test).