
Figure 2.
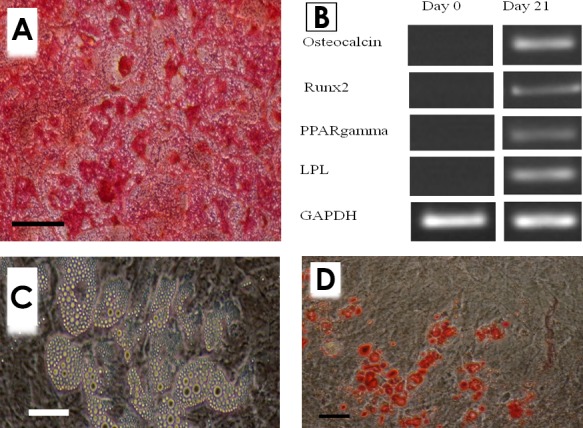
Multilineage differentiation potential of MSCs. A) Osteogenic culture of mouse marrow MSCs stained by alizarin red (Bar=200 µm), B) Unstained adipogenic culture of the same cells: lipid droplets in the fat cells are easily observable (Bar=50 µm), C) Adipogenic culture stained by Oil red (Bar=100 µm), C) Differentiated cells expressed bone and adipose-specific genes.