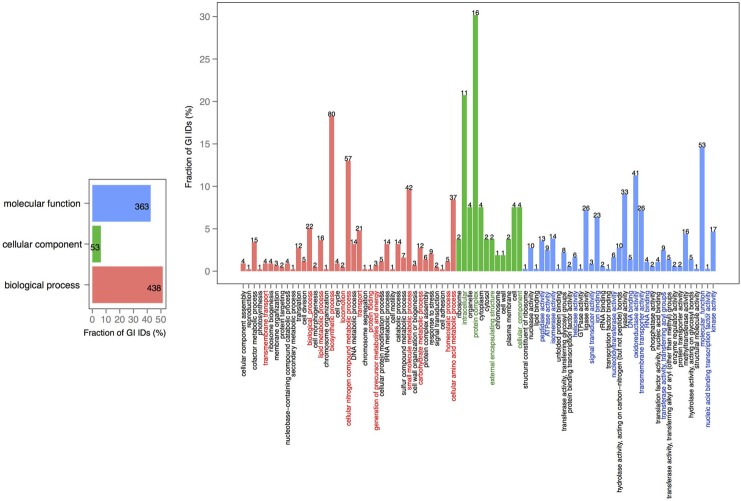
Figure 5.
GO term analysis in protein coding genes shared within chromosome 2 and missing in the core of chromosome 1. The distribution is shared both as percentage on the axis and the absolute number above the bar. The absolute number shows the amount of GO IDs that were connected to the pathway. The color code is as follows: red is the biological process, green is the cellular component, and blue is the molecular function.

