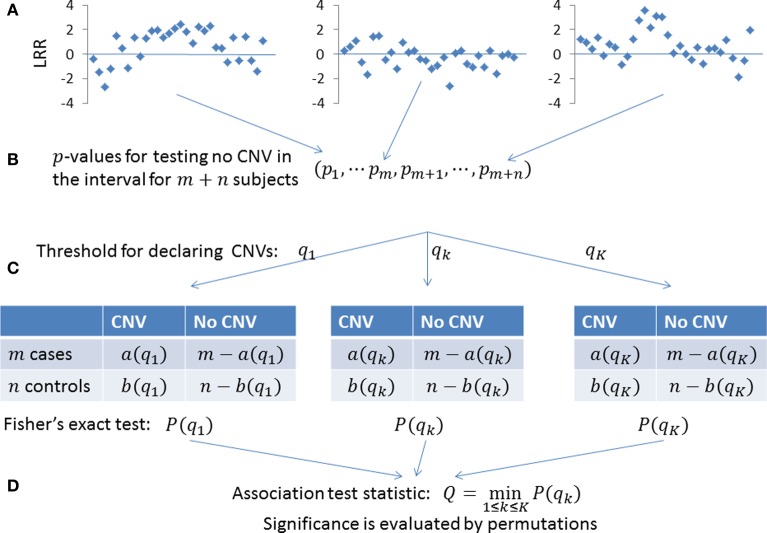
Figure 2.
Testing the association of CNVs in a given genomic region. (A) LRRs in the given genomic region for m + n subjects. (B) The existence of a CNV anywhere in the region is quantified as a p-value. A small p-value indicates the presence of a CNV. (C) For a given threshold q1, subjects with p-value < q1 are determined as tentative CNV carriers. We have a(q1) CNV carriers in m cases and b(q1) CNV carriers in n controls, with the association tested by the Fisher's exact test. To make the power robust, we use multiple thresholds (q1, …, qK) to derive association p-values (P(q1), …,P(qK)). (D) The overall statistics is defined as the minimum of (P(q1), …,P(qK)) and its significance is determined by permuting the case-control status.

