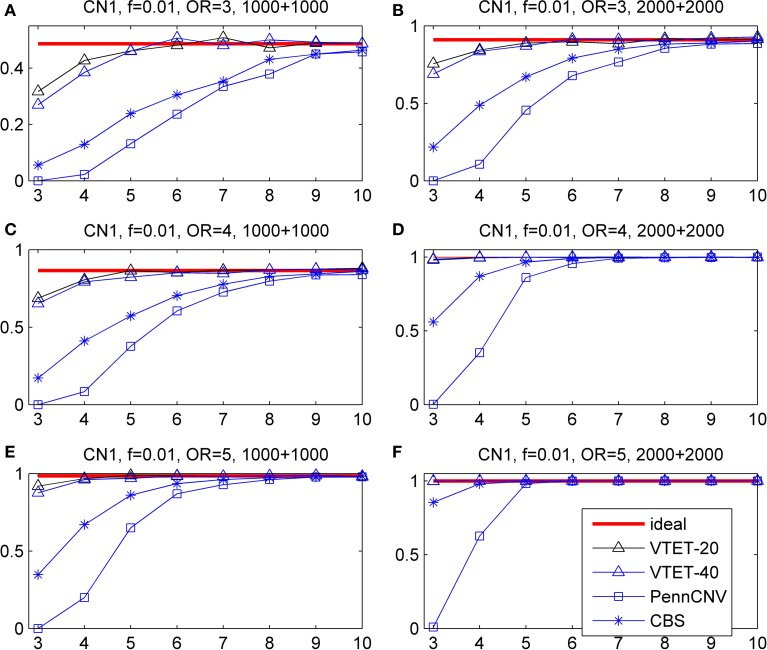
Figure 3.
Statistical power for detecting the association of hemizygous deletions (CN1) with locations randomly distributed in a given region. f is the frequency of CNVs in the general population. OR is odds ratio. The left three panels are based on 1000 cases and 1000 controls. The right three panels are based on 2000 cases and 2000 controls. The x-coordinate is the number of probes covered by the deletions. Powers were calculated based on the significance level α = 0.001. “ideal” denotes the power when CNV status is known and thus represents the limit of the performance of any method. “PennCNV” and “CBS” are the powers from the two-step approach: first calling CNVs using the algorithms and then testing associations based on identified CNVs. The power of PennCNV or CBS does not depend on the length of the interval. “VTET-20 (40)” is the power for detecting CN1 associations in a genomic region with 20 (40) probes using VTET.

