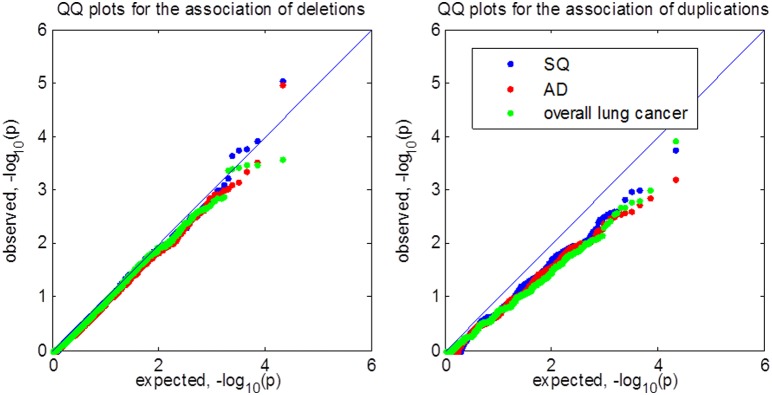
Figure 6.

Quantile-quantile (QQ) plot of p-values for testing CNV associations in the EAGLE lung cancer GWAS. SQ represents lung squamous cell carcinoma. AD represents lung adenocarcinoma. We tested for CNV associations in 10,957 segments covering 50 probes using VTET. All analyses shared the same set of control samples.
