Fig. 6.
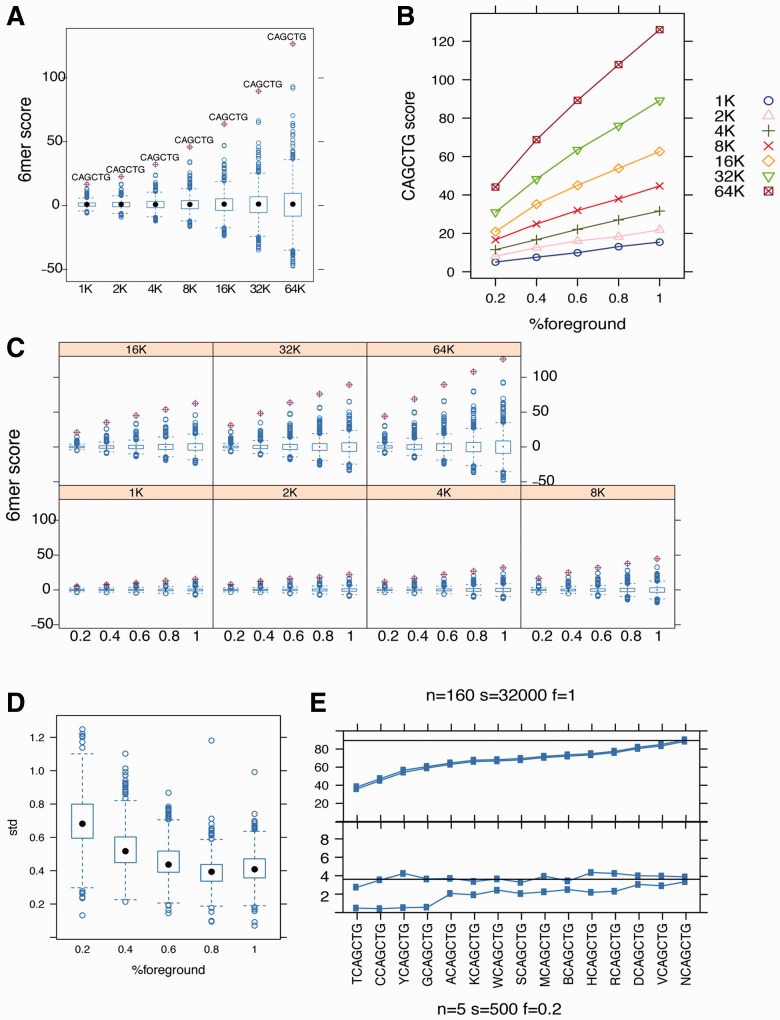
Motif significance with respect to sample size and enrichment. (A) Score distribution of for all 6mers. CAGCTG ebox, marked by ‘+’, is the most significant 6mer for all sample sizes. X-axis: dataset sample size. Y-axis: motif scores. (B). Correlation between motif scores (Y-axis) against true foreground proportion (X-axis). Curves with different symbols correspond to different sample sizes. (C) Distribution of all 6mers with varying sample size and proportion of true foreground; CAGCTG is highlighted by ‘+’. X-axis: the proportion of true foreground in shuffled foreground, Y-axis: motif scores. Panels correspond to different sample sizes. (D) The standard deviation of motif scores for all CAGCTG −1 extensions based on bootstraps decreases with the proportion of true foreground. Y-axis: the standard deviation. X-axis: the proportion of true foreground. (E) When motif enrichment is low, motif scores are more variable. X-axis: all −1 extensions of CAGCTG. Y-axis: motif scores. The 95% confidence intervals are plotted based on bootstrapping mean and variance. Upper panel: 160 bootstrap iterations, total sample size 32 000 and 100% of true foreground; lower panel: using 5 bootstrap iterations, total sample size 500 and only 20% of true foreground

