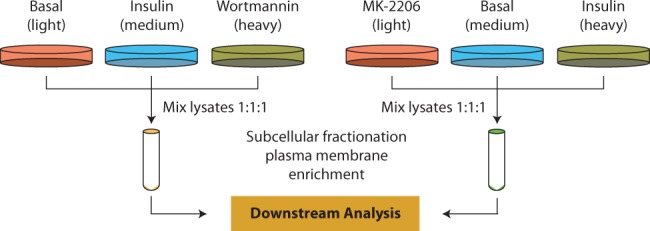
Fig. 2.

MS-based plasma membrane proteomic profiling and analysis. Two sets of SILAC-based quantitative proteomics were performed to quantify plasma membrane proteome level in basal condition, insulin stimulation, prior inhibition of PI3K using Wortmannin followed by insulin stimulation and prior inhibition of Akt using MK-2206 followed by insulin stimulation
