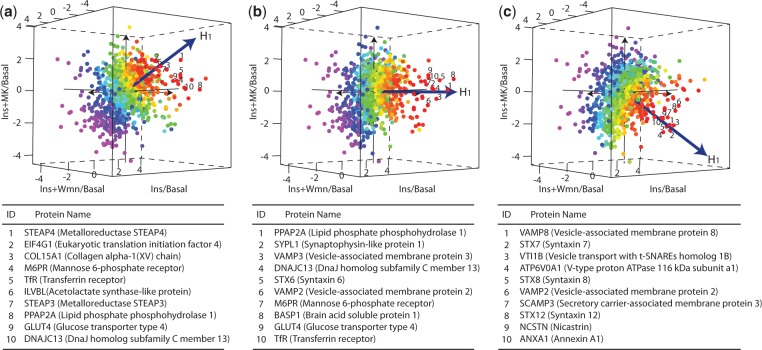
Fig. 3.
Projections of plasma membrane proteome using DPA. A total of 997 proteins with quantitation in all treatments are coloured by their statistical significance calculated from OSP across perturbations on the tested directions. The red proteins are the most significant and purple are the least significant proteins. Plots (a–c) are the scatter plots of plasma membrane proteome from testing in the directions described by tests 1, 2 and 3, respectively. The top-10 proteins ranked on each direction are further listed below the scatter plots

