Fig. 4.

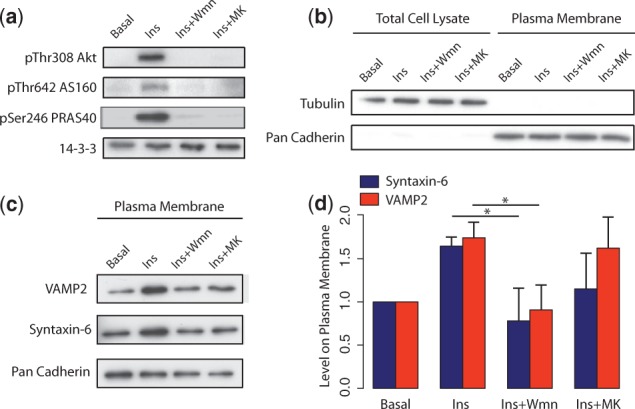
Immunoblotting of vesicle trafficking proteins. (a) Insulin stimulation and inhibitor efficacy control panel. (b) Plasma membrane isolation control panel. (c) Immunoblotting of Syntaxin-6 and VAMP2 proteins in plasma membrane fraction. (d) Bar graph represents densitometry quantification of the immunoblots normalized to that of cadherin. The entire experiments were repeated three times and the error bars represent the standard deviations in three experiments. 
