
Fig. 5.
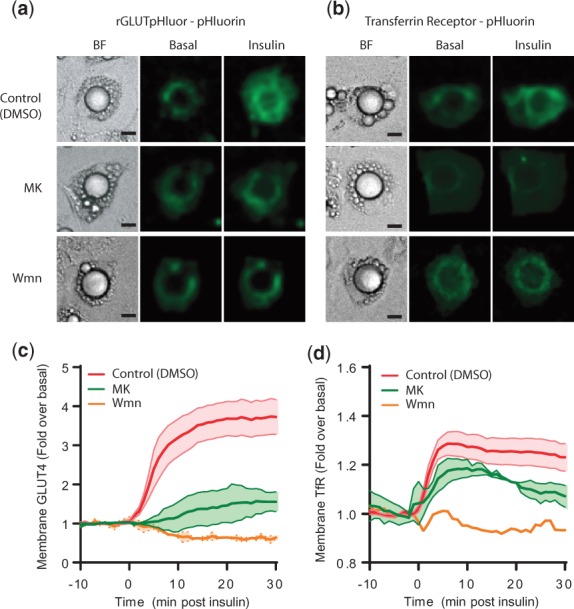
Microscopy of GLUT4 and TfR. (a and b) are images of 3T3-L1 adipocytes expressing either (a) rGLUTpHluor or (b) TfR-pH pre-treated with either DMSO (control), wortmannin, of MK-2206 before the insulin stimulation. Individual cells are shown before and 20 min after stimulation with insulin. Scale bar equals to 10 μm. (c and d). Time course of insulin stimulated changes in the PM levels of (c) GLUT4 and (d) TfR-pH pre-treated with either MK-2206, wortmannin or DMSO (control). Data represent the mean ± standard error from 3–5 experiments