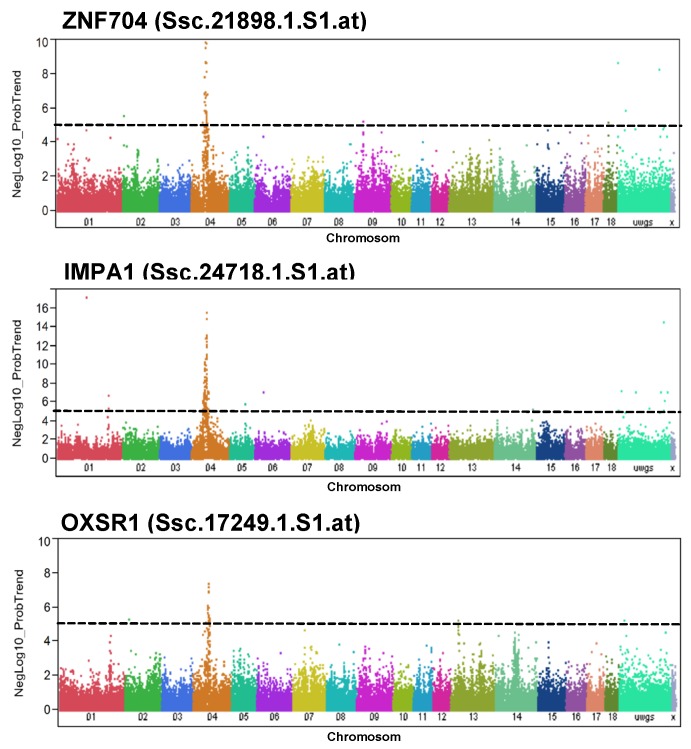
Figure 2.
Genome-wide association with the abundance of selected transcripts in Pi×(GL×LW). Manhattan plots of genome-wide association analyses of transcript abundance of ZNF704, IMPA1, and OXSR1 in Pi×(GL×LW). Black lines indicate the significance threshold corresponding to negative log10 (NegLog10)>5.

