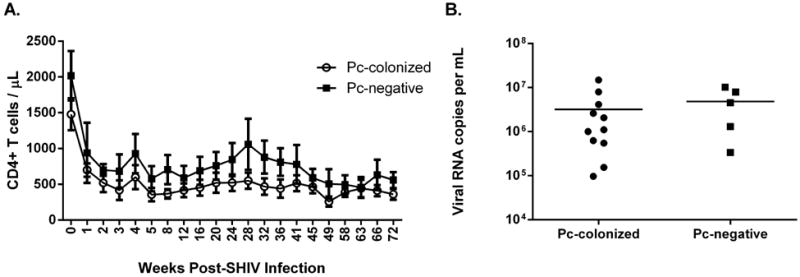
Figure 2. CD4+ T cells and peak plasma viral loads were similar between Pneumocystis-colonized and Pneumocystis-negative macaques.

CD4+ T cell percentages were measured by flow cytometry of peripheral blood cells at baseline and at serial time-points following SHIV-infection. Counts were determined from absolute differential cell counts. SHIV RNA copies per mL of plasma were measured by an adapted quantitative PCR for detection of the SIV gag sequence. CD4+ T cell numbers (A, p=0.17, 2-way repeated measures ANOVA) and peak plasma viral loads (B, p=0.35, unpaired t-test).
