
Figure 2.
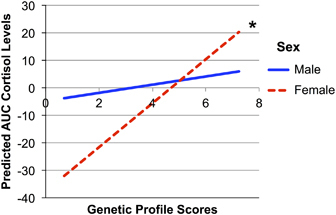
Regression-predicted effects of genetic profile scores on cortisol split by sex. The lines display the simple slopes of genetic profile scores predicting area under the curve (AUC) cortisol levels for males and females at mean values of all covariates (ethnicity, life events, genetic profile scores × life events, regional and WBV, and diagnostic status). Significant simple slopes are marked on the graph *p<0.05.