
Figure 4. CD2 expression levels on lymphocyte subpopulations.
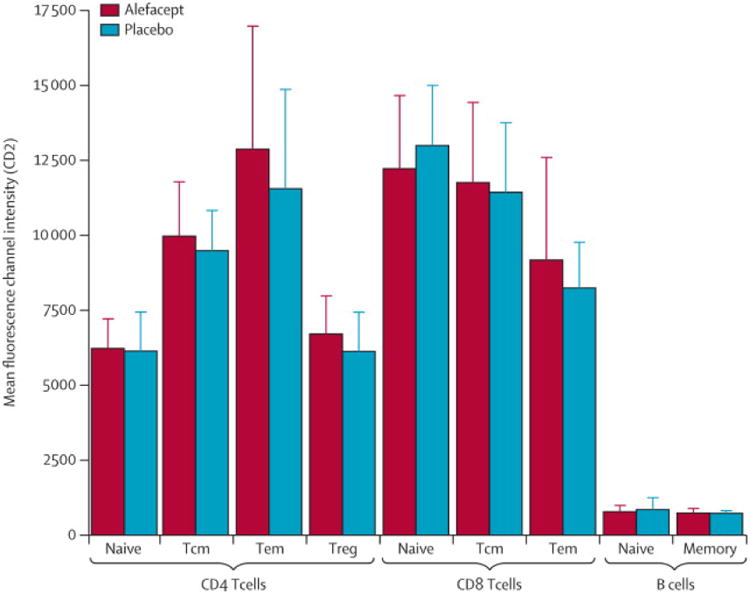
Frozen PBCMs collected at baseline were analyzed for the mean fluorescence intensity (MFI) of CD2 by flow cytometry. Lymphocyte subpopulations were defined as follows: CD4 naïve (Tn): CD3+CD4+FoxP3−CD127hiCCR7+CD45RA+; CD4 central memory (Tcm): CD3+CD4+FoxP3−CD127hiCCR7+CD45RA−; CD4 effector memory (Tem): CD3+CD4+FoxP3−CD127hiCCR7−CD45RA−; regulatory T cells (Treg): CD3+CD4+FoxP3+CD127lo; CD8 Tn: CD3+CD8+CCR7+CD45RA+; CD8 Tcm: CD3+CD8+CCR7+CD45RA−; CD8 Tem: CD3+CD8+CCR7−CD45RA−; Naïve B cells: CD19+CD27−; Memory B cells: CD19+CD27+. Values are mean±SD.