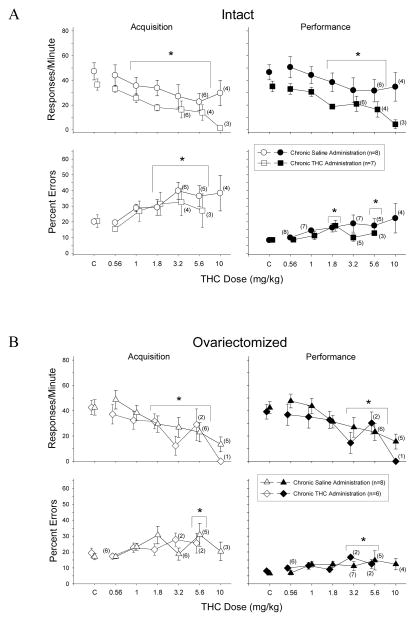
Fig. 3.
Acute effects of Δ9-THC in intact (A) and OVX (B) adult female rats responding under a multiple schedule with acquisition and performance components. Data points and vertical lines above C in each panel indicate the grand mean and standard error of the mean (SEM) for 7–16 saline (control) injections. The data points and vertical lines in the dose-effect curves represent a grand mean and SEM for that dose, as the majority of the doses were determined at least twice in each subject. Asterisks and brackets indicate significant differences from acute saline (control) injections. Numerical values in parentheses and adjacent to a data point indicate the number of subjects represented by that point when it differed from the total number of subjects for that group (e.g., instances in which responding was eliminated entirely and the percentage of errors could not be calculated, or simply differences in the potency of Δ9-THC across subjects).

