
Figure 9.
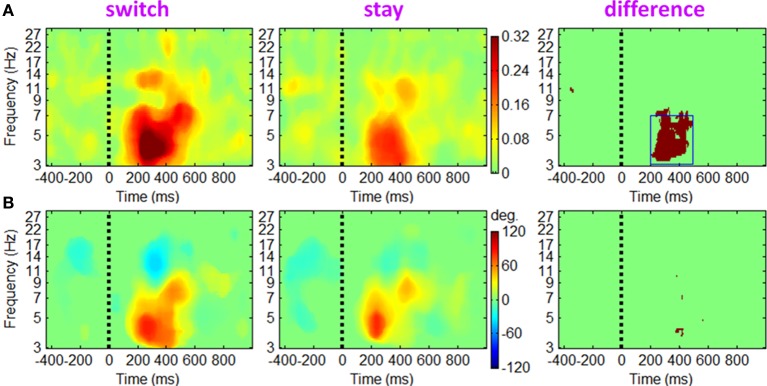
The ERCOH measurements between fronto-central theta and the left mu IC clusters. (A) The phase cross-coherence magnitude. Colors show significant ERCOH magnitude between the two IC clusters (p < 0.01). The dark red region in the third column shows significant ERCOH differences between the two conditions based on paired t-tests (p < 0.001). (B) This figure highlights the phase difference between the two IC clusters at time-frequency points where ERCOH magnitude in (A) is significant.