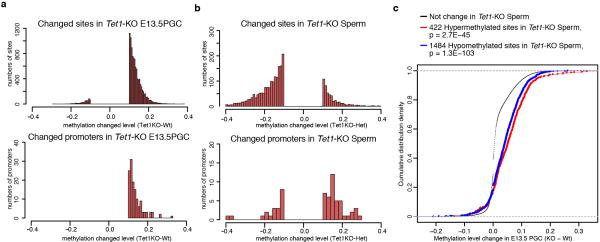
Extended Data Figure 5. Summary of RRBS analysis.
a, b, Distribution of the methylation change level for changed sites and promoters in E13.5 PGCs (a) and Sperm (b) (cutoff, 10 %). c, Cumulative distribution curve of methylation change in E13.5 PGC for the methylation changed sites in Tet1-KO sperm. Note that methylation level in E13.5 Tet1-KO PGCs of both 422 hypermethylated sites in sperm (red) and 1484 hypomethylated sites in sperm (blue) are higher than that of non-changed sites.

