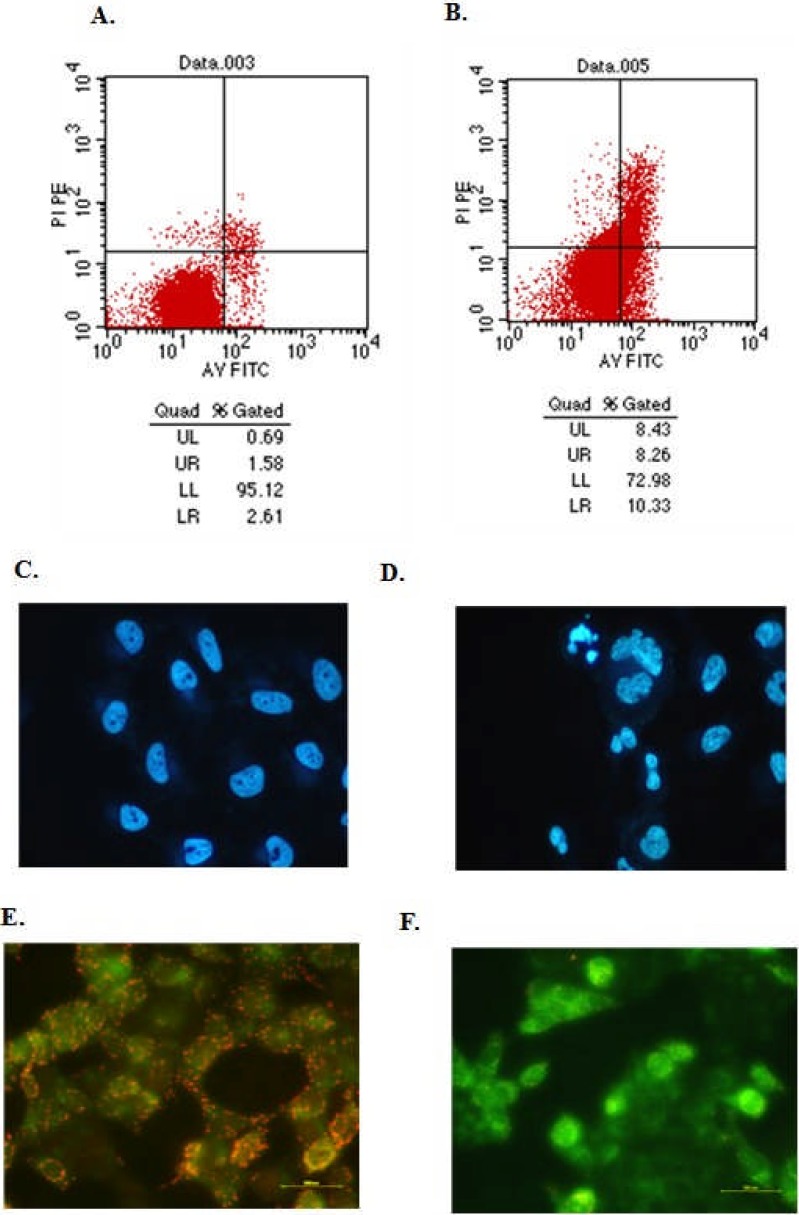
Figure 3.
HQG treatment induces cancer cell apoptosis: Cells from the ascites of tumour-bearing mice without (A) or with (B) HQG administration were stained by Annexin V-FITC/PI followed by flow cytometry analysis to analyse cell apoptosis. UL represents the percentage of dead cells; UR represents the percentage of non-active cells; LR represents the percentage of apoptotic cells; LL represents the percentage of living cells. Human hepadoma 7402 cells were treated with (D, F) or without (C, E) HQG (50 µg/mL) for 48 hrs and then Hoechst 33342 and JC-1 staining was performed to examine the cell morphology.

