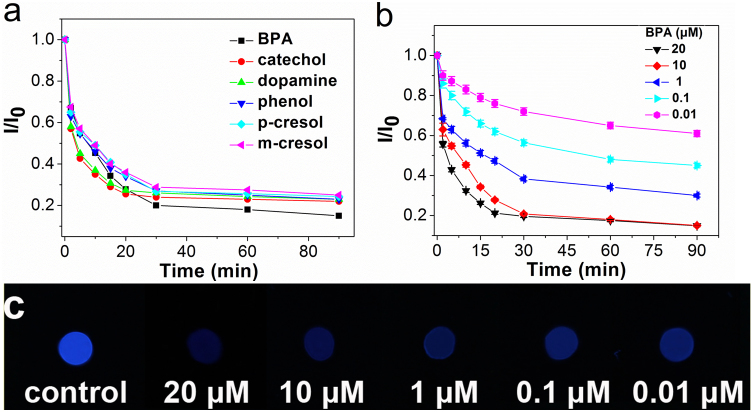
Figure 5. Detection of phenolic compounds on Ag/PFPMO nanocomposite films.
(a) Change of I/I0 as a function of time in the presence of 10 μM of different phenolic compounds. (b) Change of I/I0 as a function of time in the presence of different concentrations of BPA. (c) Fluorescence photographs of PFPMO under 365-nm UV light in the presence of different concentrations of BPA. Error bars correspond to the standard deviation calculated from three separate measurements.

