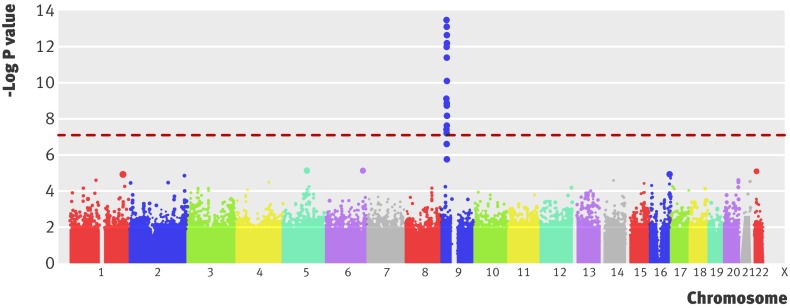
Fig 2 Manhattan plot from a genome-wide association study of myocardial infarction (adapted, with permission, from Samani and colleagues13). The x axis refers to points along the genome (separated by chromosome) at which each of the several hundred thousand single nucleotide polymorphisms (SNPs; represented by a dot) evaluated are located. The y axis refers to the negative logarithm of the P value for a test of association between each SNP and the binary outcome—the presence or absence of disease. For example, a −log P value of 7 (shown by the dashed red line) equates to a P value for the association of an SNP with disease of 1×10⁻⁷ or 0.0000001, and a −log P value of 7.3 equates to 5×10⁻⁸

An official website of the United States government
Here's how you know
Official websites use .gov
A
.gov website belongs to an official
government organization in the United States.
Secure .gov websites use HTTPS
A lock (
) or https:// means you've safely
connected to the .gov website. Share sensitive
information only on official, secure websites.
