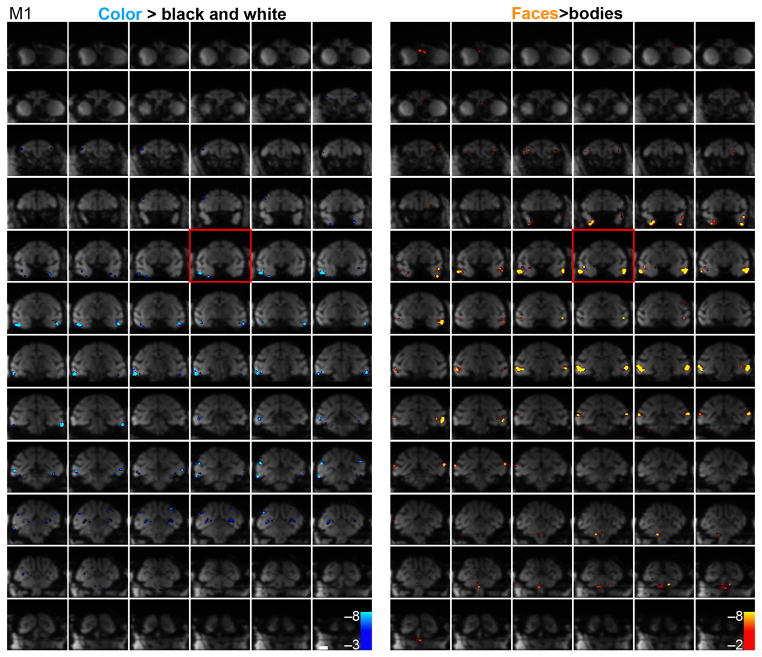
Figure 4.
Raw functional echo planar (EPI) coronal images showing MION activation every 1 mm; color-biased activation (blue, left panels) and face-biased activation (blue, right panels) of M1. See Supplementary Figure 5 for these data obtained in M2. Spurious activation outside the brain has been masked. The slice corresponding to Talairach coordinate 0 along the P-A axis is boxed in red. Scale bar, 1 cm.

