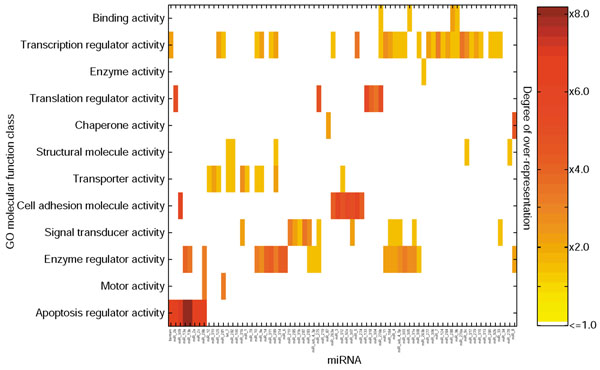
Figure 2.

Functional map of miRNAs and their target genes. Left axis: selected over-represented FlyBase [49] derived GO [87] classifications from the 'molecular function' hierarchy. Bottom axis: ordered list of the 73 miRNAs. Each cell in the matrix is color-coded according to the degree of over-representation (right axis) for a miRNA hitting a specific functional class. For example, a bright red box indicates that a given miRNA hits six to eight times more targets in a particular class then one would expect by chance. The matrix is built by two-dimensional hierarchical clustering after normalization for classes that are over-represented in FlyBase annotations as a whole.
