
Figure 4.
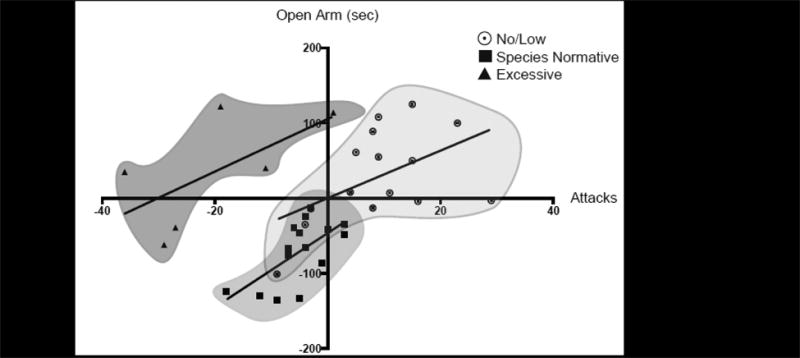
Linear correlation plots for the simple linear regression analyses of each individual subpopulation of AAS-induced aggressive responders for the difference (i.e., P77 minus P57) in the number of attacks and the difference (i.e., P77 minus P57) in time spent in the open arms of the elevated plus maze during adolescent AAS exposure (i.e., at P57) and AAS withdrawal (i.e., at P77). ¤ = No/Low Responders, o = Species Normative Responders, and ▲ = Excessive Responders.