
Figure 2.
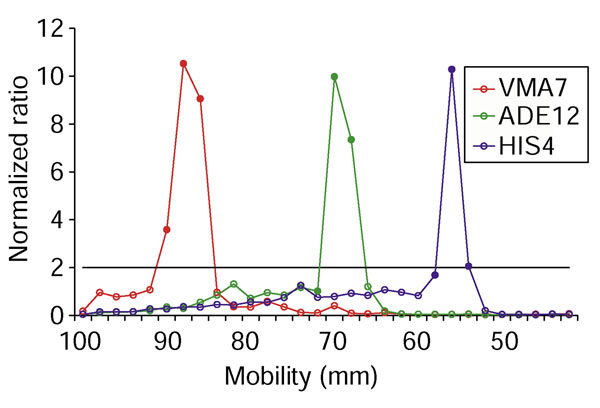
Examples of length profiles. Each length profile is a plot of the normalized ratio from all 30 microarrays. The x-axis is the distance of the midpoint of each gel slice from the origin. The black line indicates the threshold fluorescence ratio for peak recognition of 2.0, and the closed circles represent the three points used to calculate the midpoint of each peak.