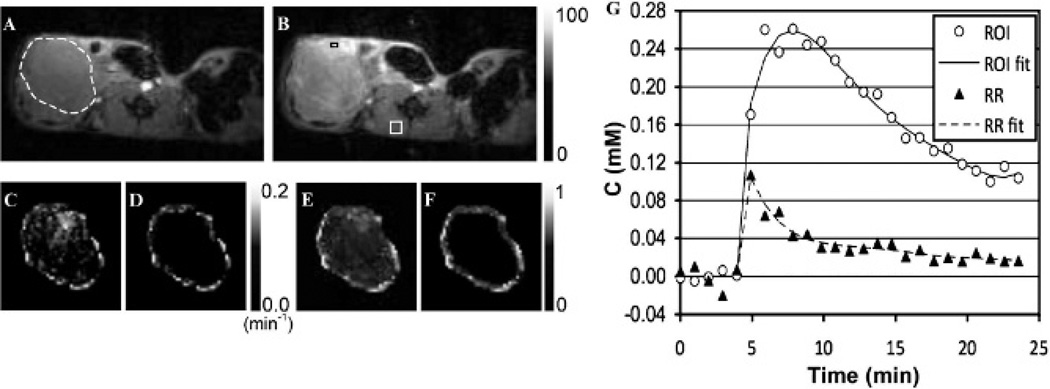
Figure 2.
Representative dynamic contrast-enhanced magnetic resonance images of a SCID mouse bearing an orthotopic pancreatic tumor at (A) 1 minute before and (B) 2 minutes after gadoteridol injection u sing the same intensity scale (from 0 to 100) when maximum value is normalized to 100, with (C, D) Ktrans and (E, F) νe maps of the (C, E) entire tumor regions or (D, F) 0.5 mm–thick peripheral tumor regions. G, Contrast enhancement curves averaged in the region of interest (ROI) and reference region (RR) indicated with the black rectangle (2 × 1 window: 2 pixels) and the white square (4 × 4 window: 16 pixels), respectively, in the subfigure (B), together with the best-fitting fifth-order polynomial curves. The boundary of the tumor region is indicated with a white dotted circle in A.

