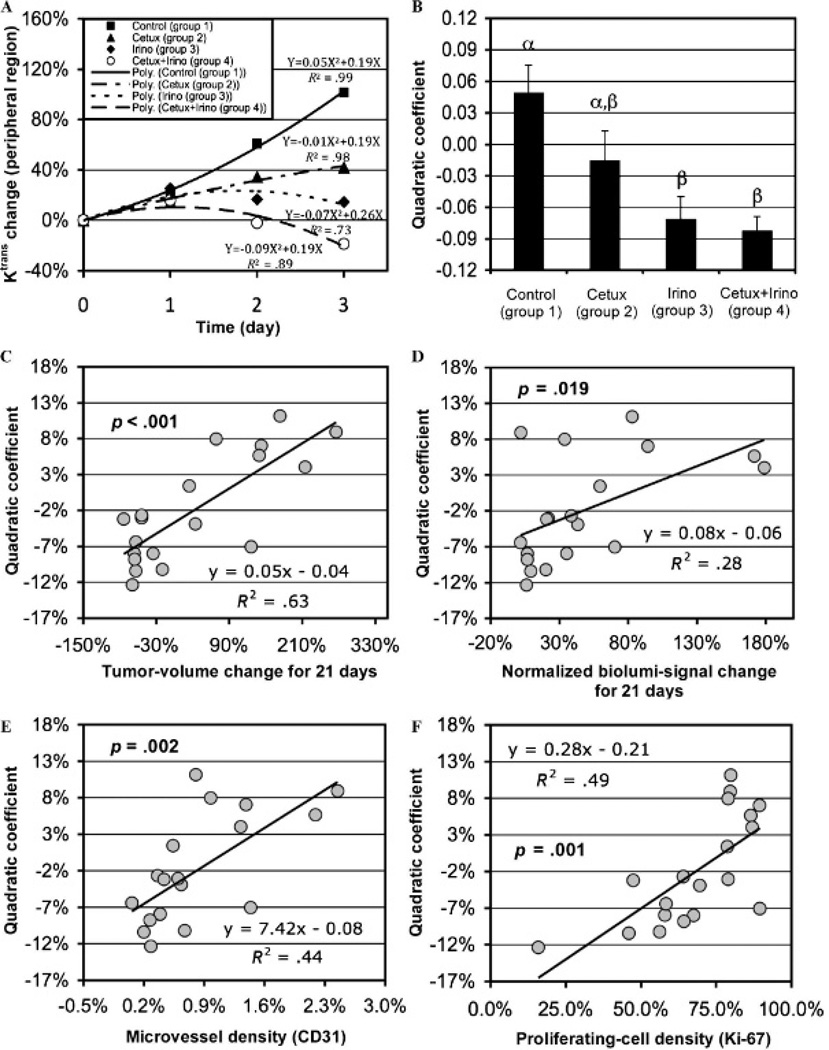
Figure 6.
A, Mean Ktrans changes of groups 1 to 4 during 3 days post–therapy initiation in the peripheral tumor region with the best-fitting second-order polynomial curves for the four groups. B, Quadratic coefficients of the best-fitting second-order polynomial curves to the Ktrans changes in the peripheral tumor region of groups 1 to 4 (mean and SE); different Greek letters represent statistical differences among the groups. The quadratic coefficients shown in B versus (C) tumor volume changes for 21 days, (D) normalized bioluminescent signal changes for 21 days, (E) microvessel densities, and (F) proliferating cell densities; p values represent the significance of the correlation.

