
Fig. 1.
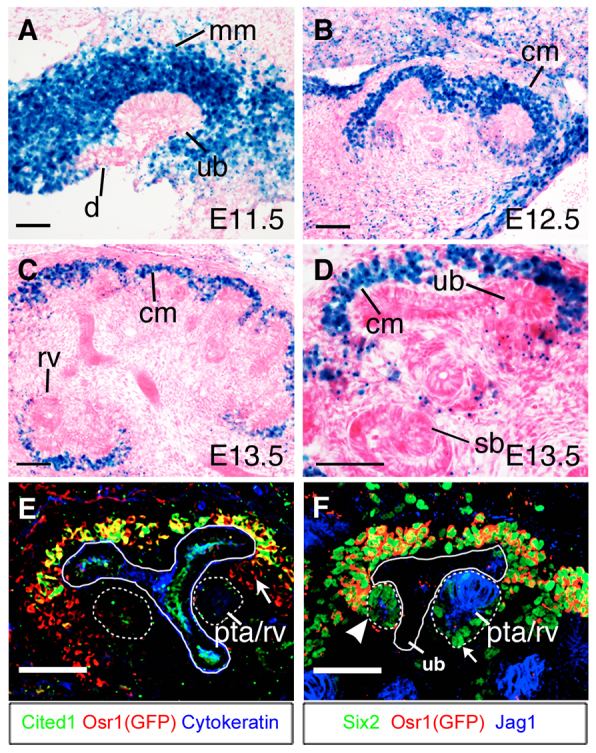
Expression of Osr1 during metanephric kidney development. (A-C) Osr1-lacZ expression in developing kidneys in Osr1tm1Jian/+ embryos at E11.5 (A), E12.5 (B) and E13.5 (C). (D) High-magnification view of the cortical region of an E13.5 Osr1tm1Jian/+ kidney section. (E) Immunofluorescent staining of eGFP (red), Cited1 (green) and pan-cytokeratin (blue) in section of E13.5 Osr1GCE/+ kidney. Arrow indicates Cited1-Osr1+ cells between the Cited1+ cap mesenchyme and pretubular aggregate (outlined with white dashed circle). (F) Immunofluorescent staining of eGFP (red), Six2 (green) and Jag1 (blue) in E13.5 Osr1GCE/+ kidney section. Arrowhead indicates early pretubular aggregate cells that have begun to express Jag1 but still have high levels of Six2 proteins. Arrow indicates cells in the distal part of the renal vesicle showing high levels of Six2 proteins. cm, cap mesenchyme; pta, pretubular aggregate; rv, renal vesicle; sb, S-shaped body. Scale bars: 50 μm.