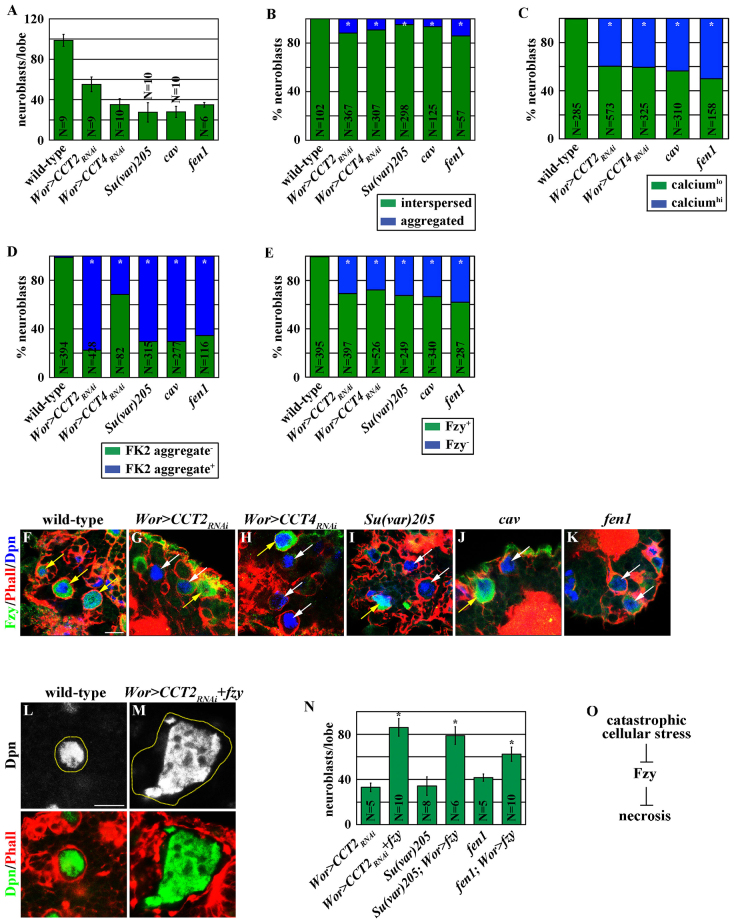
Fig. 5.
Catastrophic cellular stress induces necrosis in neuroblasts by attenuating the Fzy-dependent survival mechanism. (A) Catastrophic cellular stress led to a drastic reduction in neuroblasts. The average number of neuroblasts per brain lobe is shown. (B-D) Neuroblasts experiencing catastrophic cellular stress exhibited necrosis markers. Brains from larvae of the indicated genotype were stained with (B) ATP5a for mitochondrial morphology, (C) GFP for calcium content and (D) FK2 for ubiquitylated aggregates. The percentage of neuroblasts with (blue) or without (green) the expression of the indicated marker is shown. The percentage of neuroblasts with (blue) or without (green) the expression of the indicated marker is shown. (E-K) Neuroblasts experiencing catastrophic cellular stress lost Fzy expression. Brains from larvae of the indicated genotype were stained for Fzy. Scale bar: 10 μm. The percentage of neuroblasts with (green) or without (blue) Fzy expression is shown in E. (L-N) Overexpression of fzy suppressed the necrosis of neuroblasts (outlined in yellow in L and M) experiencing catastrophic cellular stress. Scale bar: 10 μm. The average number of neuroblasts per brain lobe is shown in N. (O) A summary cartoon showing how catastrophic cellular stress induces the necrosis of neuroblasts by attenuating Fzy expression.

