
Fig. 4.
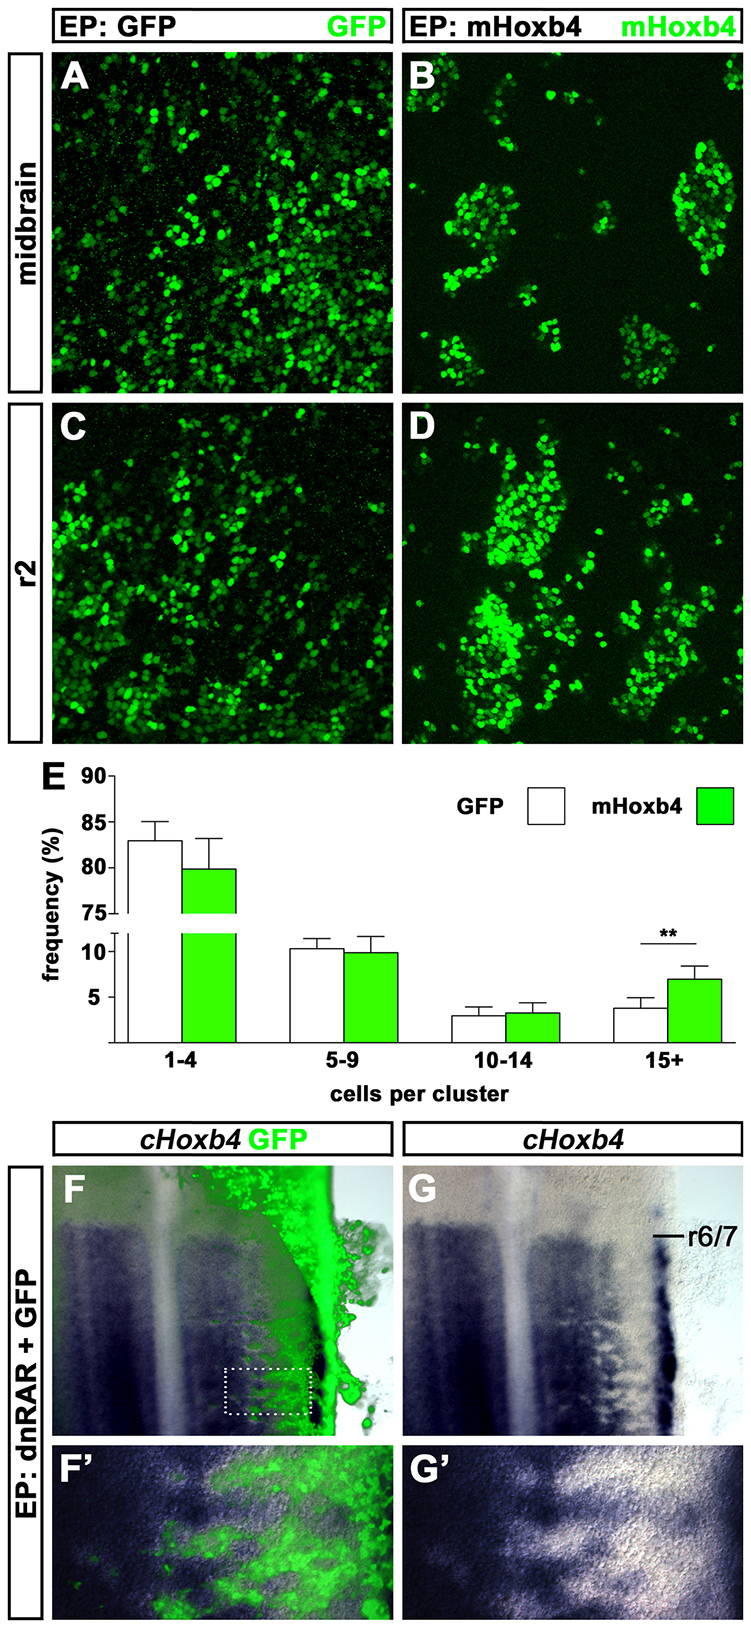
Mosaic Hoxb4 expression induces chick neuroepithelial cell segregation. (A-D) Confocal z-projections of flat-mount hindbrains electroporated with an nlsGFP control plasmid (A,C) or a mouse Hoxb4-ires-nlsGFP plasmid (B,D). Electroporated cells are detected by GFP or mouse Hoxb4 immunostaining (green) as indicated. The region of the CNS shown is indicated on the left (r2 or midbrain). (E) Frequency distribution of cell cluster sizes in nlsGFP electroporated (white columns, n=19 independent fields from six embryos) and mouse Hoxb4 electroporated (green columns, n=22 independent fields from eight embryos) hindbrains. Clusters of 15+ cells are found more frequently in mouse Hoxb4 electroporated hindbrains. Error bars indicate 95% confidence interval (**P=0.0062, Mann-Whitney test). (F-G′) Flat-mount chick hindbrains after co-electroporation of separate dnRAR and GFP plasmids. Electroporated GFP-expressing cells (green) form cell clusters and are associated with strong downregulation of chick Hoxb4 mRNA expression in r7 and more posterior CNS regions. (F′,G′) are higher magnifications of the area indicated by the dotted box.