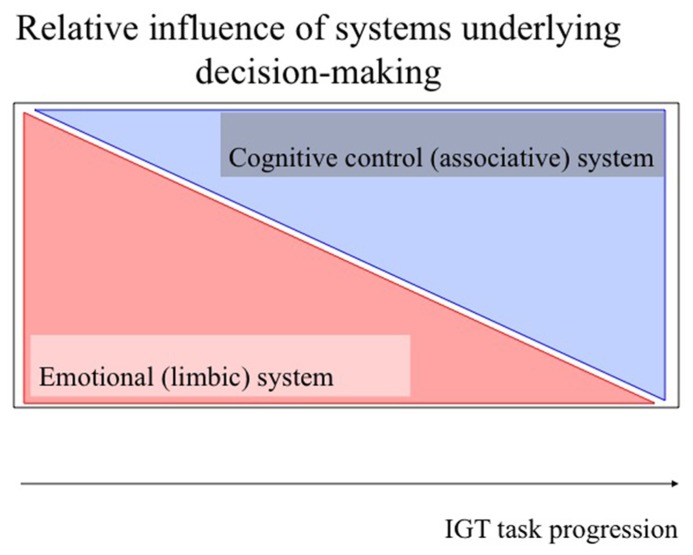
FIGURE 1.
Schematic model of the role of different systems in task-progression in the IGT. The horizontal axis represents the progression of the task, while the vertical axis represents relative activity. The upper and lower triangle represent the relative contribution of the different brain systems which may be involved in the different stages of the test: learning relevant task-relevant features (emotional (limbic) system; transparent red), and consistently directing behavior toward choosing cards from the long-term advantageous decks [cognitive control (associative) system; transparent blue, see text for further explanation].

