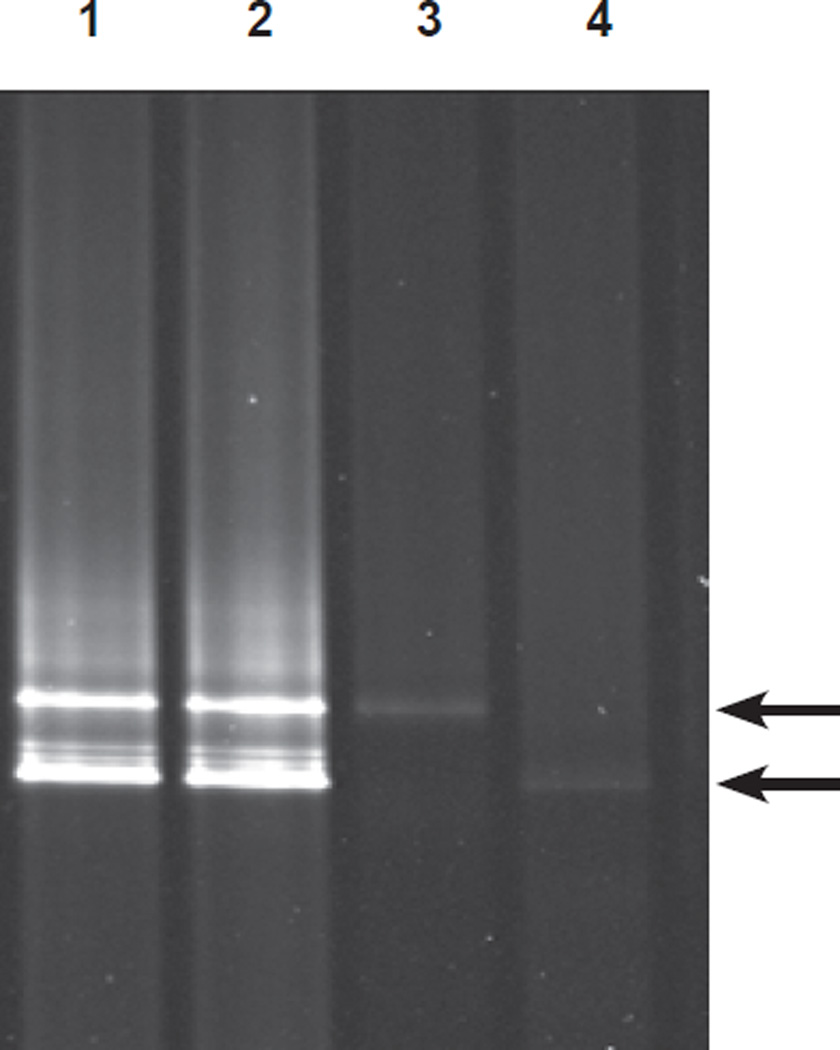
Fig. 2.
DGGE profile of amplified DNA from isolate 70-2. Lanes 1 and 2: PCR products from duplicate amplifications of template DNA from isolate 70-2. Lanes 3 and 4: DNA excised from the top (lane 3) and bottom (lane 4) bands of the isolate 70-2 DGGE profile. Excised DNA was subjected to DGGE without re-amplification. Arrows indicate the location of the top and bottom bands.

