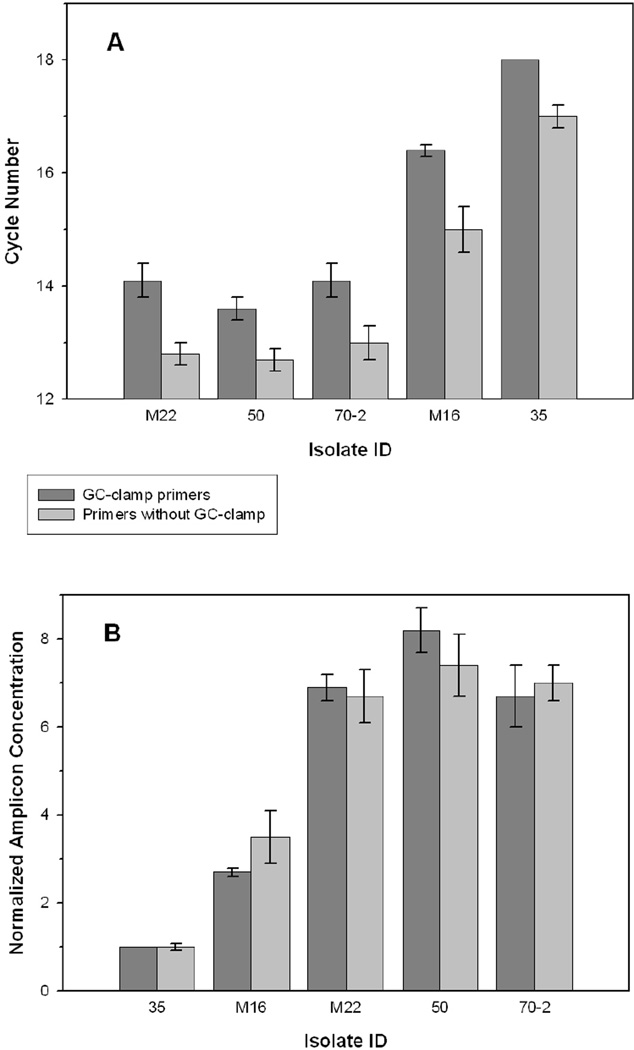
Fig. 4.
Analysis of cycle threshold (CT) values from qPCR of equal concentrations of template DNA from each isolate. (A) CT values for isolates amplified using the primer sets with and without the GC-clamp. CT values represent the average of triplicate reactions for each isolate using 11.5 ± 0.6 ng template DNA in 25 µl reactions and analyzed at the user defined threshold points of 20 RFU for the GC-clamp primer set and 90 RFU for the primer set without the GC-clamp. Error bars represent the standard deviations and the standard deviation for isolate 35 amplified with the GC-clamp primers was 0. (B) Amplicon concentrations of each isolate normalized with respect to the fluorescence value for 35 at the CT value identified in Fig. 4A.

