
Figure 1.
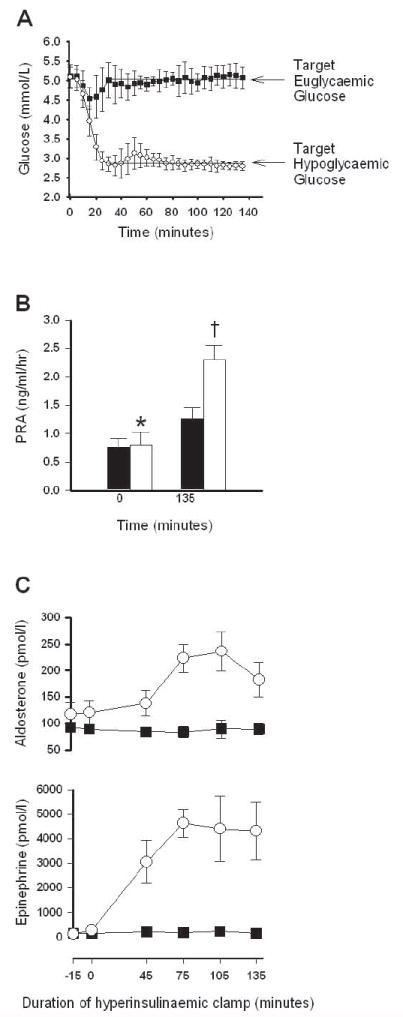
(a) Serum glucose levels during euglycaemic hyperinsulinaemic clamp studies (closed squares) and during hypoglycaemic hyperinsulinaemic clamp studies (open circles). Arrow indicates target glucose of 5.0 mmol/l for the euglycaemia protocol and 2.8 mmol/l for the hypoglycaemia protocol. (b) Plasma renin activity (PRA) levels at baseline (T = 0 min) and end (T = 135 min) of the euglycaemic (black bars) and hypoglycaemic (open bars) hyperinsulinaemic clamp studies. *P < 0.05 vs. baseline euglycaemia; †P < 0.001 vs. all other groups; n = 8 per group. (c) Aldosterone (n = 12) and epinephrine (n = 5) levels during the hypoglycaemic hyperinsulinaemic clamp (open circles) and euglycaemic hyperinsulinaemic clamp (black squares), P < 0.001 for aldosterone and P < 0.0001 for epinephrine by repeated measures ANOVA.