
Figure 2.
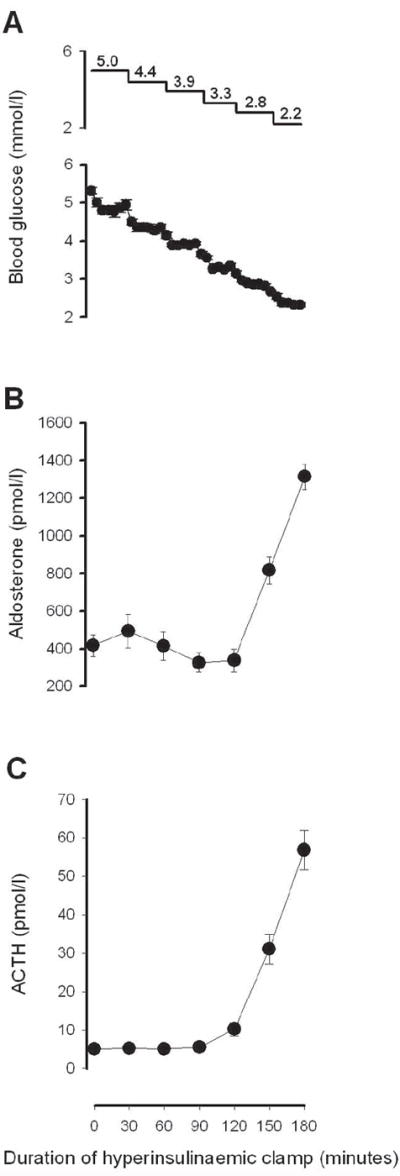
(A) Serum glucose, (B) aldosterone and (C) ACTH levels during the 180-min stepped, hypoglycaemic, hyperinsulinaemic clamp study, n = 13; P < 0.001 for each hormone by repeated measures ANOVA. ACTH values were reported previously (17). Upper panel in (a) indicates target blood glucose levels.