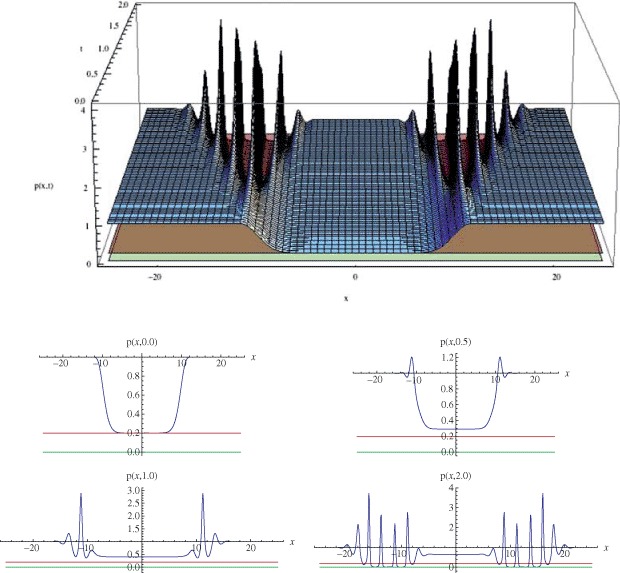
Figure 1.

Simulation with ρ = 1.0, Λ = 19.0, δ = 0.1, η = 0.2, f(p) = p(1.0 − p), g(p) = p(Λ − p), h(x) = arctan (100.0x)/(10.0x arctan 100.0) and initial data ϕ0(x) = 1.0 − 0.8 exp(−(0.1x)10). The red plane and lines correspond to η = 0.2 and the green plane and lines correspond to 0.0. (a) Graph of p(x, t), 0 ≤ t < 2.0. The wound does not close, and instead the solution exhibits an evolving pattern of peaks and valleys which do not converge to 1.0. (b) Graphs of p(x, .0), p(x, .5), p(x, 1.0), p(x, 2.0). The solution stays above 0.0, but not above η = 0.2.
