. 2014 Mar 18;3:e01939. doi: 10.7554/eLife.01939

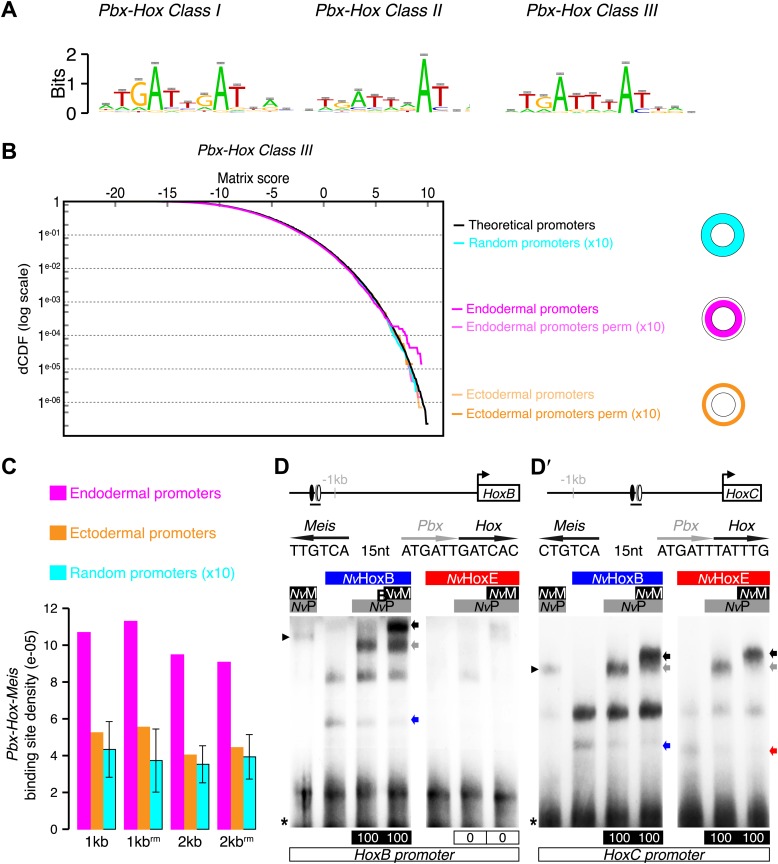
Figure 5. Genes expressed in the endoderm are enriched in Hox-TALE binding sites in their promoter region.

(A) Hox/Pbx binding motifs represented as logos. The three motifs represent the binding specificity of the Hox/Pbx complex for sites of class I, II, or III. Matrix was determined by Selex with the Drosophila proteins (Slattery et al., 2011). (B) Score distributions of the Hox/Pbx Class III matrix. The Y-axis is shown in logarithmic scale to highlight the relevant range of p values (small values). The separation of the pink curve (endoderm) from the black one (theoretical distribution) indicates an enrichment of the Hox/Pbx putative binding sites in the promoter of genes expressed in the endoderm. On the contrary, there is no enrichment in the promoter of genes expressed in the ectoderm, as the orange curve follows the black one. All negative controls also show no enrichment: random sets of gene promoters (cyan), promoter regions randomized by matrix column permutations for the endoderm (light pink) and ectoderm (light orange). (C) In silico analysis of Hox/Pbx/Meis binding sites in the promoter region (1 kb or 2 kbs upstream of the transcription start site) of genes expressed in the endoderm (pink), ectoderm (orange), or randomly chosen (cyan). The graph illustrates the preferential enrichment of Hox/Pbx/Meis binding sites in the promoter region of endodermal genes. Rm: repeat masked. (DD′) Band shift experiments between NvHox and NvTALE proteins on binding sites found in the promoter region of NvHoxB and NvHoxC genes. Sequence and genomic position of each binding site are shown above the gel. Colour code and annotations are as in Figure 3. Note the distinct DNA-binding preferences of NvHoxB and NvHoxE on these two different target sites. See also Figure 5—figure supplements 1 and 2.

DOI: http://dx.doi.org/10.7554/eLife.01939.012

Figure 5.

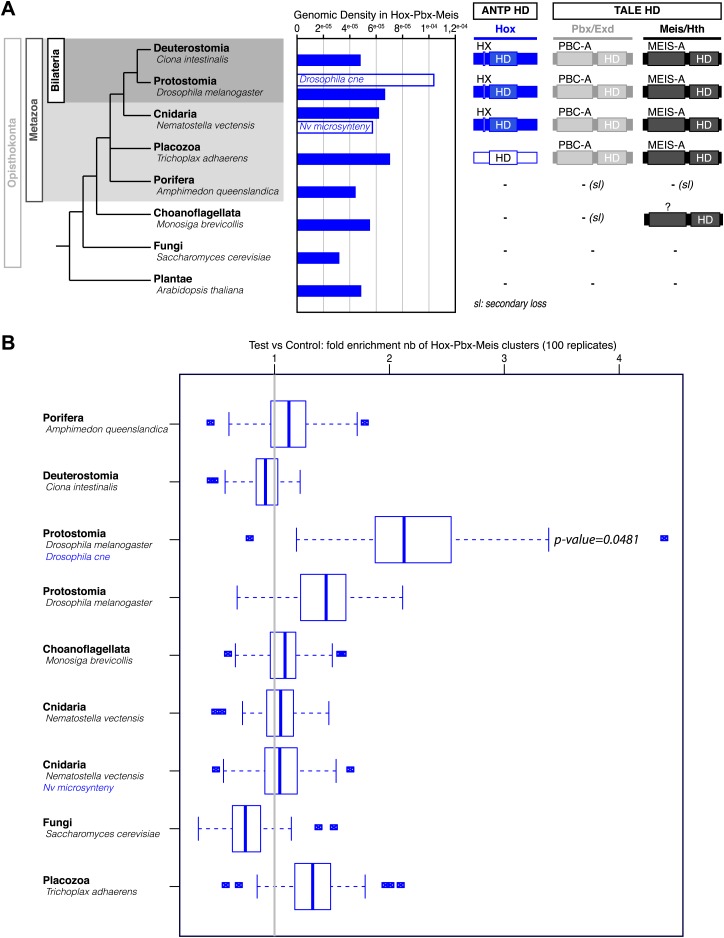
Figure 5—figure supplement 1. Genome-wide analysis cannot reveal significant enrichment of Hox/PBC/Meis binding sites.

Figure 5—figure supplement 1.

(A) Density of Hox/PBC/Meis clusters in the genome of various organisms. The density was calculated on all non-coding regions of the genomes (blue-filled bars), repeat-masked except for Amphimedon where the repeat-masked genome was the same as the non-repeat-masked one. Two other conditions (white bars) represent a subset of the genome. The non-coding regions (CNE) conserved in 12 Drosophila genomes show a higher density than genome-wide approaches. These results suggest that the search space needs to be reduced to obtain a good signal/noise ratio. One idea would be to search for conserved regions within cnidarians, taking Nematostella as reference, but such an analysis was beyond the scope of this project, and the divergence time of available cnidarian genomes might not be adapted to this analysis. We attempted a related analysis by taking microsyntenic regions as described in Irimia et al. (2012). The results do not show a high density comparable to the Drosophila CNEs. We hypothesize that these microsyntenic regions still have a low signal to noise ratio for these motif clusters, or that biologically, the Hox/Pbx + Meis cluster is not majorly involved in the regulation taking place at these regions conserved throughout metazoans. (B) Validation of cluster enrichment. For each organism, we calculated the enrichment of Hox/PBC/Meis clusters, compared to a random control. At first, we conducted this analysis on random sequences, artificially generated from Markov models trained on the genomes of interest, and taking into account the number and positions of the repeats. The results, however, were highly dependent on the order of the Markov model. To circumvent this, we used randomized motifs as a control, allowing us to keep working on the real genomic sequences. We permuted the motif positions 100 times, allowing, removing the biological signal, while retaining the statistical properties of the PSSMs describing the motifs. We observed a clear enrichment of the clusters in Drosophila CNEs. In contrast, most of the genome-wide analyses did not reveal any enrichment, except in Drosophila, which showed a slight enrichment similar to Trichoplax. As Trichoplax has no HX-containing ANTP proteins (therefore no Hox/PBC/Meis network), with signal to noise ratio still quite low, we did not consider this slight enrichment.
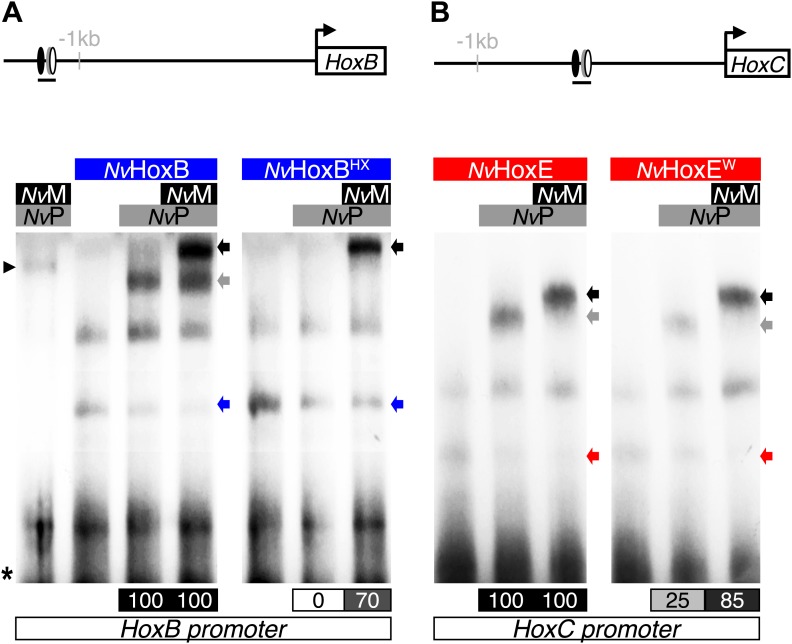
Figure 5—figure supplement 2. NvMeis promotes HX-independent interaction modes on DNA-binding sites found in the promoter region of NvHoxB (A) and NvHoxC (B).

Figure 5—figure supplement 2.

Band shift experiments are performed with wild-type or HX-mutated forms of NvHoxB and NvHoxE, in the presence of NvTALE cofactors, as indicated. Loss of dimeric NvHox/NvPbx complexes upon the HX mutation is rescued in the presence of NvMeis. Values of the interaction levels are shown at the bottom of the gel. Asterisk marks the free probe. Black arrowhead (left) corresponds to the dimeric NvPbx/NvMeis complex. Coloured, grey, and black arrows (right) show monomer, dimer, and trimer DNA-binding complexes, respectively.