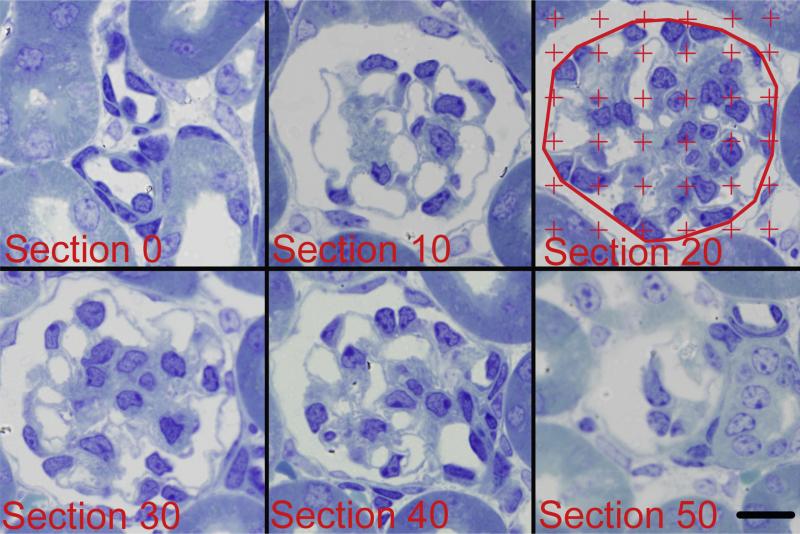
Fig. 2.
Six images (10 μm apart) from a glomerulus used to measure glomerular volume. The glomerulus was defined as the minimal string polygon surrounding the glomerular tuft as shown in Section 20. A counting grid was randomly placed over each image and the number of grid points falling on the glomerular profile was counted. Glomerular volume was calculated by multiplying the distance between sections (10 μm) by the sum of the points counted over all the glomerular profiles, and then multiplied by the area represented by 1 grid point. Scale bar = 10 μm.

