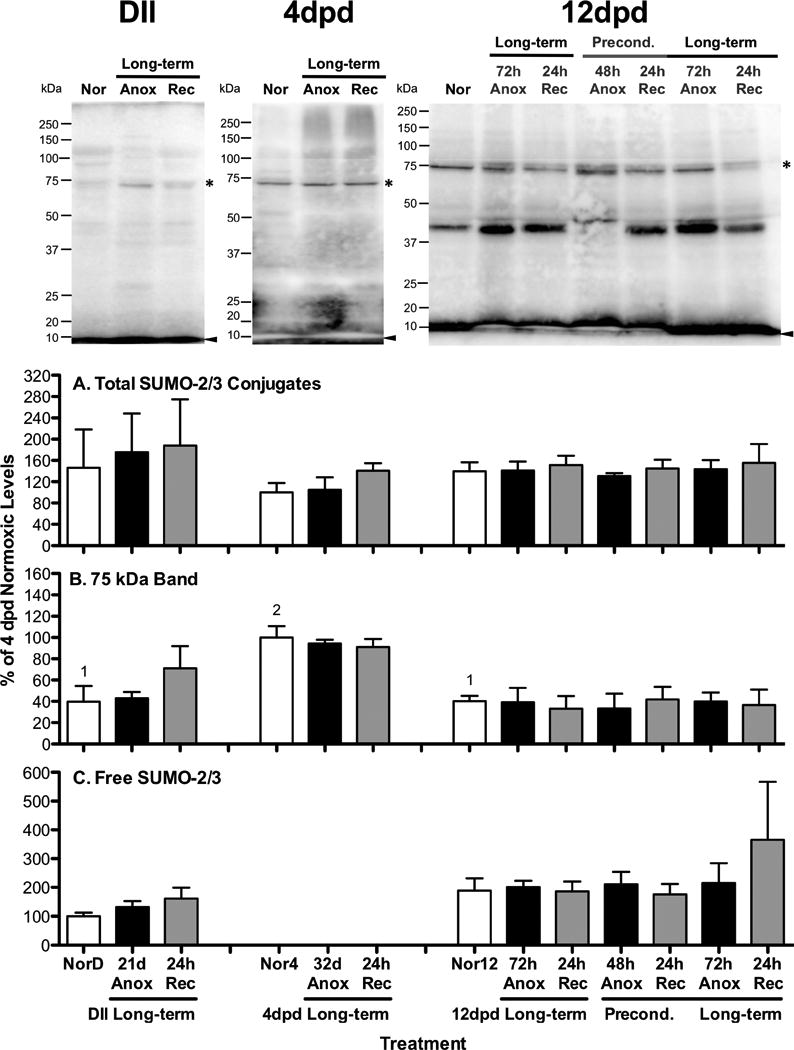
Figure 3. SUMO-1 conjugate levels in A. limnaeus embryos exposed to anoxia.

Representative blots for each embryonic stage investigated (DII = diapause II, dpd = days post-diapause II) are presented at the top of the figure. Bar charts represent quantification of SUMO-1 conjugated proteins. Total SUMO-1 conjugates (A) were quantified between 20 and 250 kDa. The 75 kDa band quantified (B) is denoted by a single asterisk in the gel images, while the 30 kDa band quantified (C) is marked by a double asterisk in the gel images. The free SUMO-1 band quantified (D) is identified by an arrowhead in the representative gel images. Each lane of each gel was loaded with 20 μg total protein. All quantifications were normalized between blots to a control sample loaded onto each gel and expressed as a percentage of the average levels in 4 dpd normoxic embryos. Bars represent means ± S.E.M. (n=3). Different letters above bars denote means that are statistically different (Student Newman-Keuls, p < 0.05, see text for details) between treatments within each developmental stage. Different numbers above normoxic bars indicate means that are statistically differrent between different developmental stages under normoxic conditions (Student Newman-Keuls, p < 0.05, see text for details). NorD = normoxic diapause II embryos; Nor4 = normoxic embryos for 4 dpd embryos; Nor12 = normoxic 12 dpd embryos. Times for exposure to long-term anoxia are equal to one half of the LT50 for anoxia in days as detailed in Table 1.
