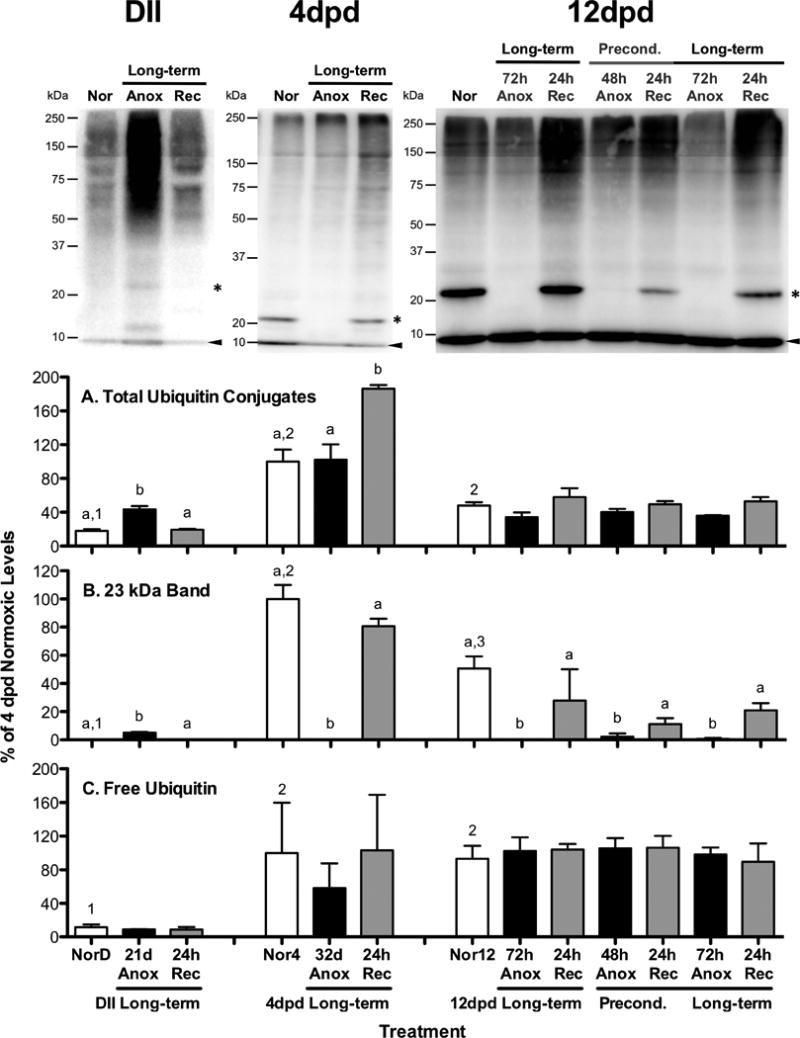
Figure 4. SUMO-2/3 conjugate levels in embryos of A. limnaeus exposed to anoxia.

Representative blots for each embryonic stage investigated (DII = diapause II, dpd = days post-diapause II) are presented at the top of the figure. Bar charts represent quantification of SUMO-2/3 conjugated proteins. Total SUMO-2/3 conjugates (A) were quantified between 20 and 250 kDa. The 75 kDa band quantified (B) is denoted with an asterisk in the gel images, while free SUMO-2/3 bands (C) are identified by an arrowhead in the gel images. Each lane was loaded with 10 μg total protein. All quantifications were normalized between blots to a control sample loaded onto each gel and expressed as a percentage of the average levels in 4 dpd normoxic embryos. Bars represent means ± S.E.M. (n=3). Different letters above bars denote means that are statistically different (Student Newman-Keuls, p < 0.05, see text for details) between treatments within each developmental stage. Different numbers above normoxic bars indicate means that are statistically differrent between different developmental stages under normoxic conditions (Student Newman-Keuls, p < 0.05, see text for details). NorD = normoxic diapause II embryos; Nor4 = normoxic embryos for 4 dpd embryos; Nor12 = normoxic 12 dpd embryos. Times for exposure to long-term anoxia are equal to one half of the LT50 for anoxia in days as detailed in Table 1.
