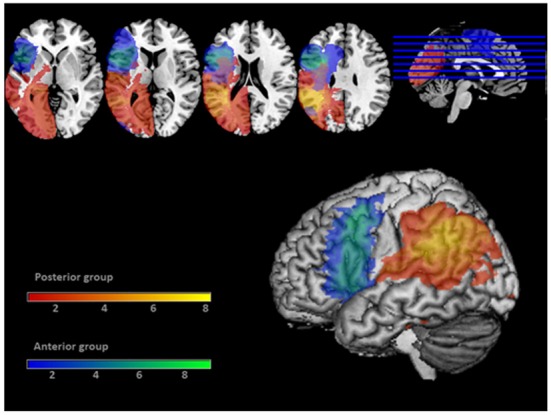
Figure 2.

Coverage map of the lesions of the 17 patients. Lesions of the Anterior patient group are displayed in blue/green. Lesions of the Posterior patient group are displayed in red/yellow. The 3D rendering displays an 8 mm search depth. Color bars display the number of subjects having lesions at each voxel.
